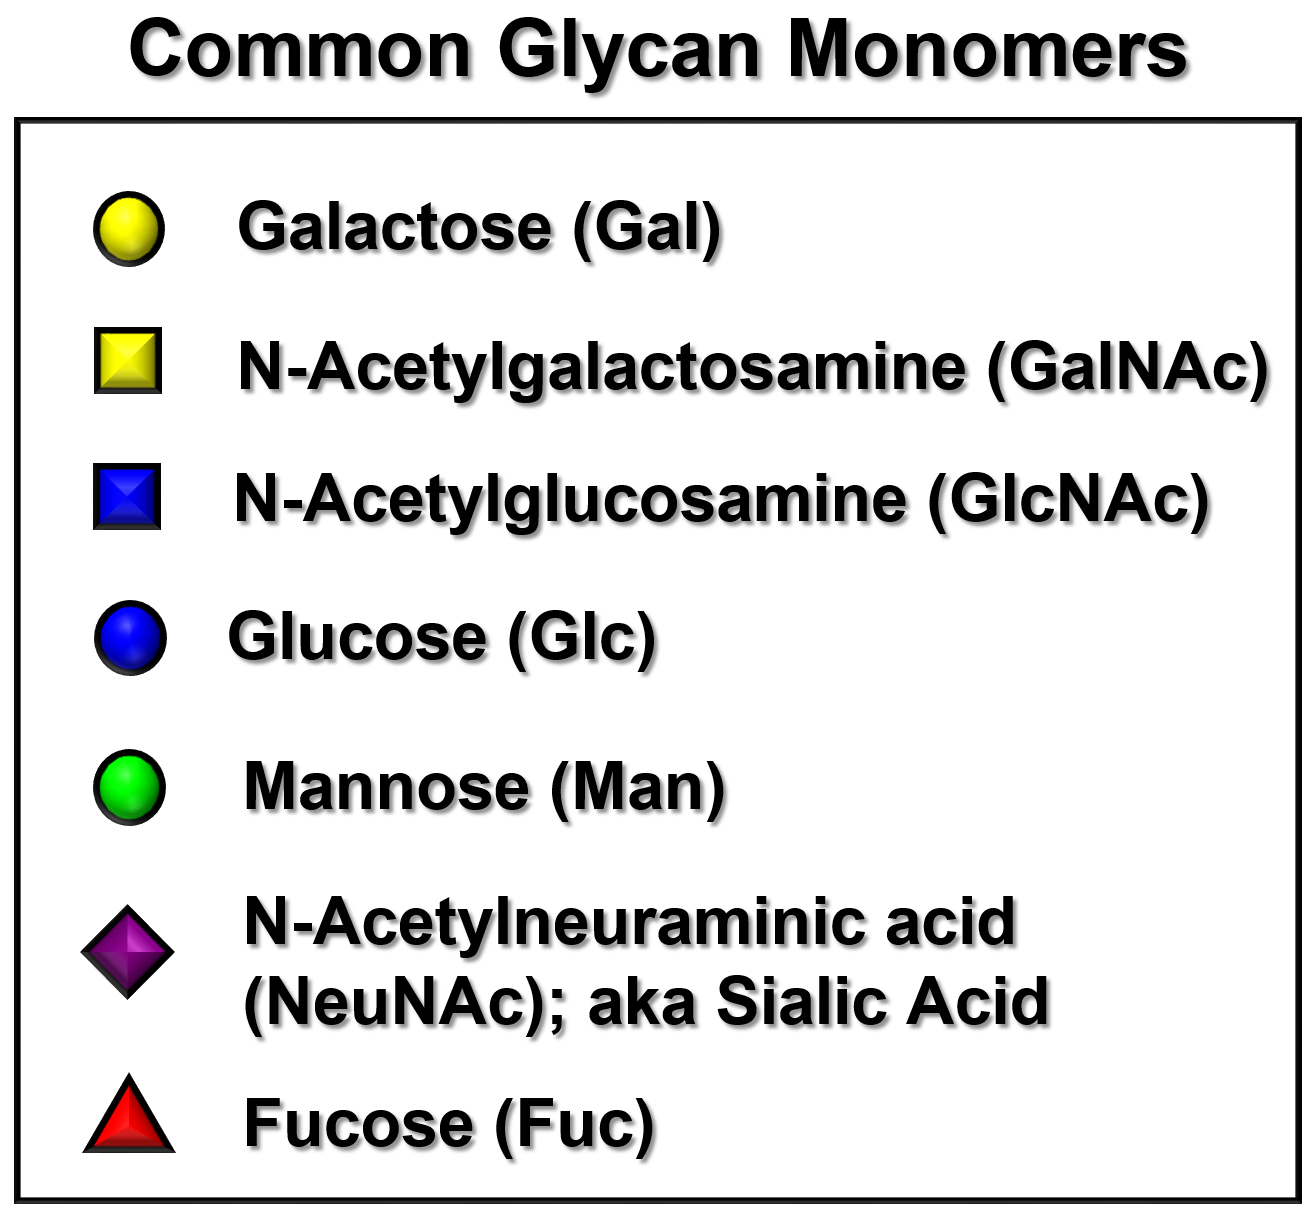
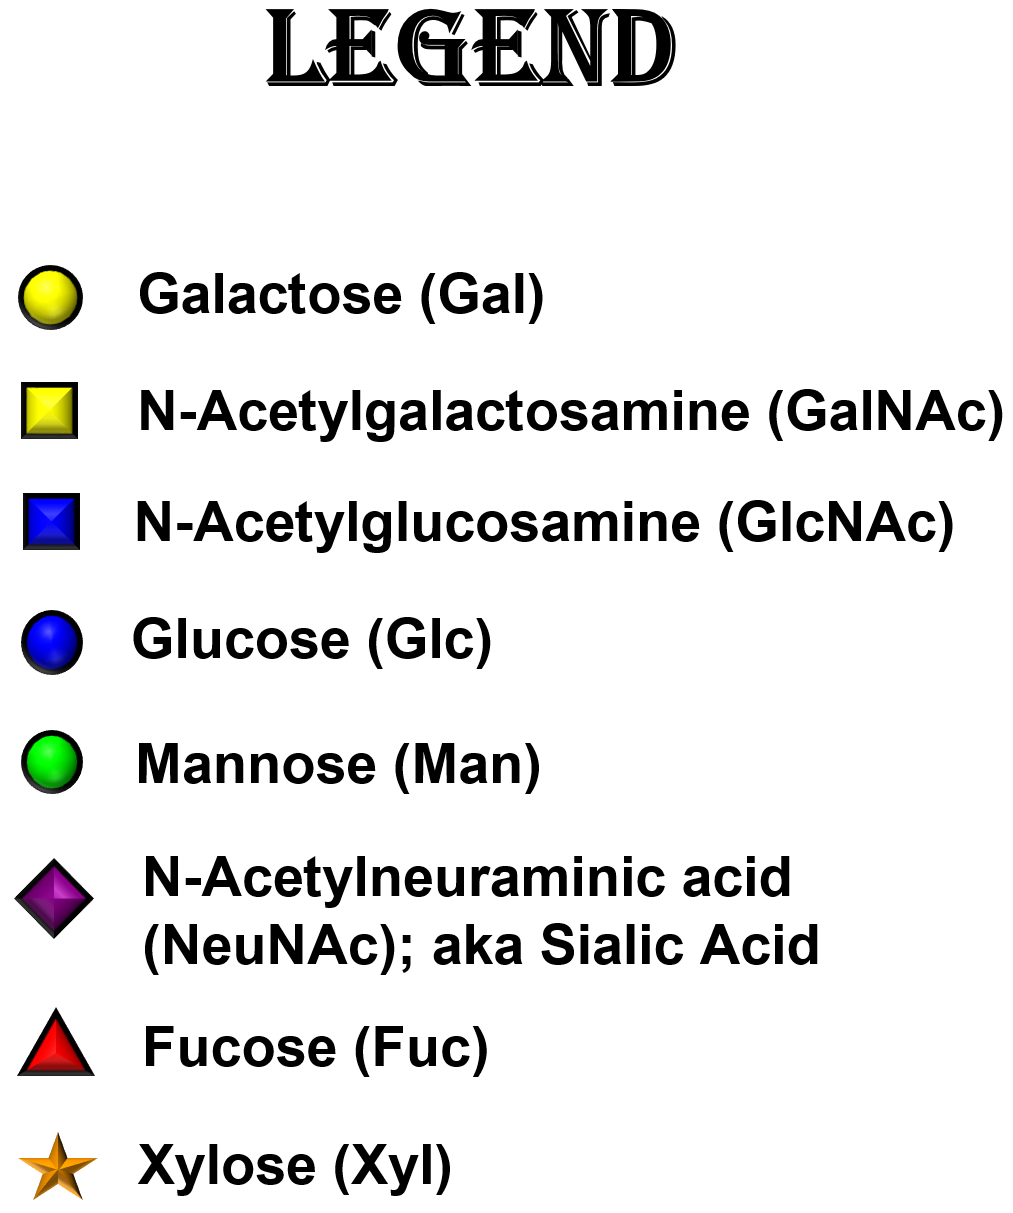
Basic Introduction: Like proteins and nucleic acids such as DNA, glycans are complex biopolymers that consist of multiple different building blocks from the same molecular class. But unlike proteins and nucleic acids whose primary structures consist of monomer units that can only connect in the front and back (like boxcars in a train) to create a linear polymer, glycan monomer units (shown without linkages below) are more like tinker-toy hubs that can each form several linkages in several places. This creates complicated branching polymer units whose primary structure is more like a tree than a string. The relative abundance of uniquely linked or branched glycan monomer units within a biospecimen are often of interest in biomedical research.
Basic Introduction: Like proteins and nucleic acids such as DNA, glycans are complex biopolymers that consist of multiple different building blocks from the same molecular class. But unlike proteins and nucleic acids whose primary structures consist of monomer units that can only connect in the front and back (like boxcars in a train) to create a linear polymer, glycan monomer units (shown without linkages at right) are more like tinker-toy hubs that can each form several linkages in several places. This creates complicated branching polymer units whose primary structure is more like a tree than a string. The relative abundance of uniquely linked or branched glycan monomer units within a biospecimen are often of interest in biomedical research.
What is Glycan Node Analysis?Click Me for Flagship Paper Traditional approaches to characterizing glycans involve measuring intact glycan masses and/or chromatographic retention times and from them accurately inferring semi-detailed glycan structures. (More details become explicitly available when tandem mass spectrometry is employed.) At the end of the day, from the compiled list of intact glycans and their relative abundances, a big-picture summary of the results is often constructed in which quantitative changes in unique glycan features such as "α2-6 sialylation", "core fucosylation", "bisecting GlcNAc", "β1-6 branching", etc. are described as the major findings of the study. We have developed a more direct quantitative route toward this end. Rather than tallying the relative abundance of these unique glycan features from across dozens of intact glycan structures, we capture them as single analytical signals--and in doing so, dramatically simplify the process of turning these unique features directly into biomarkers.
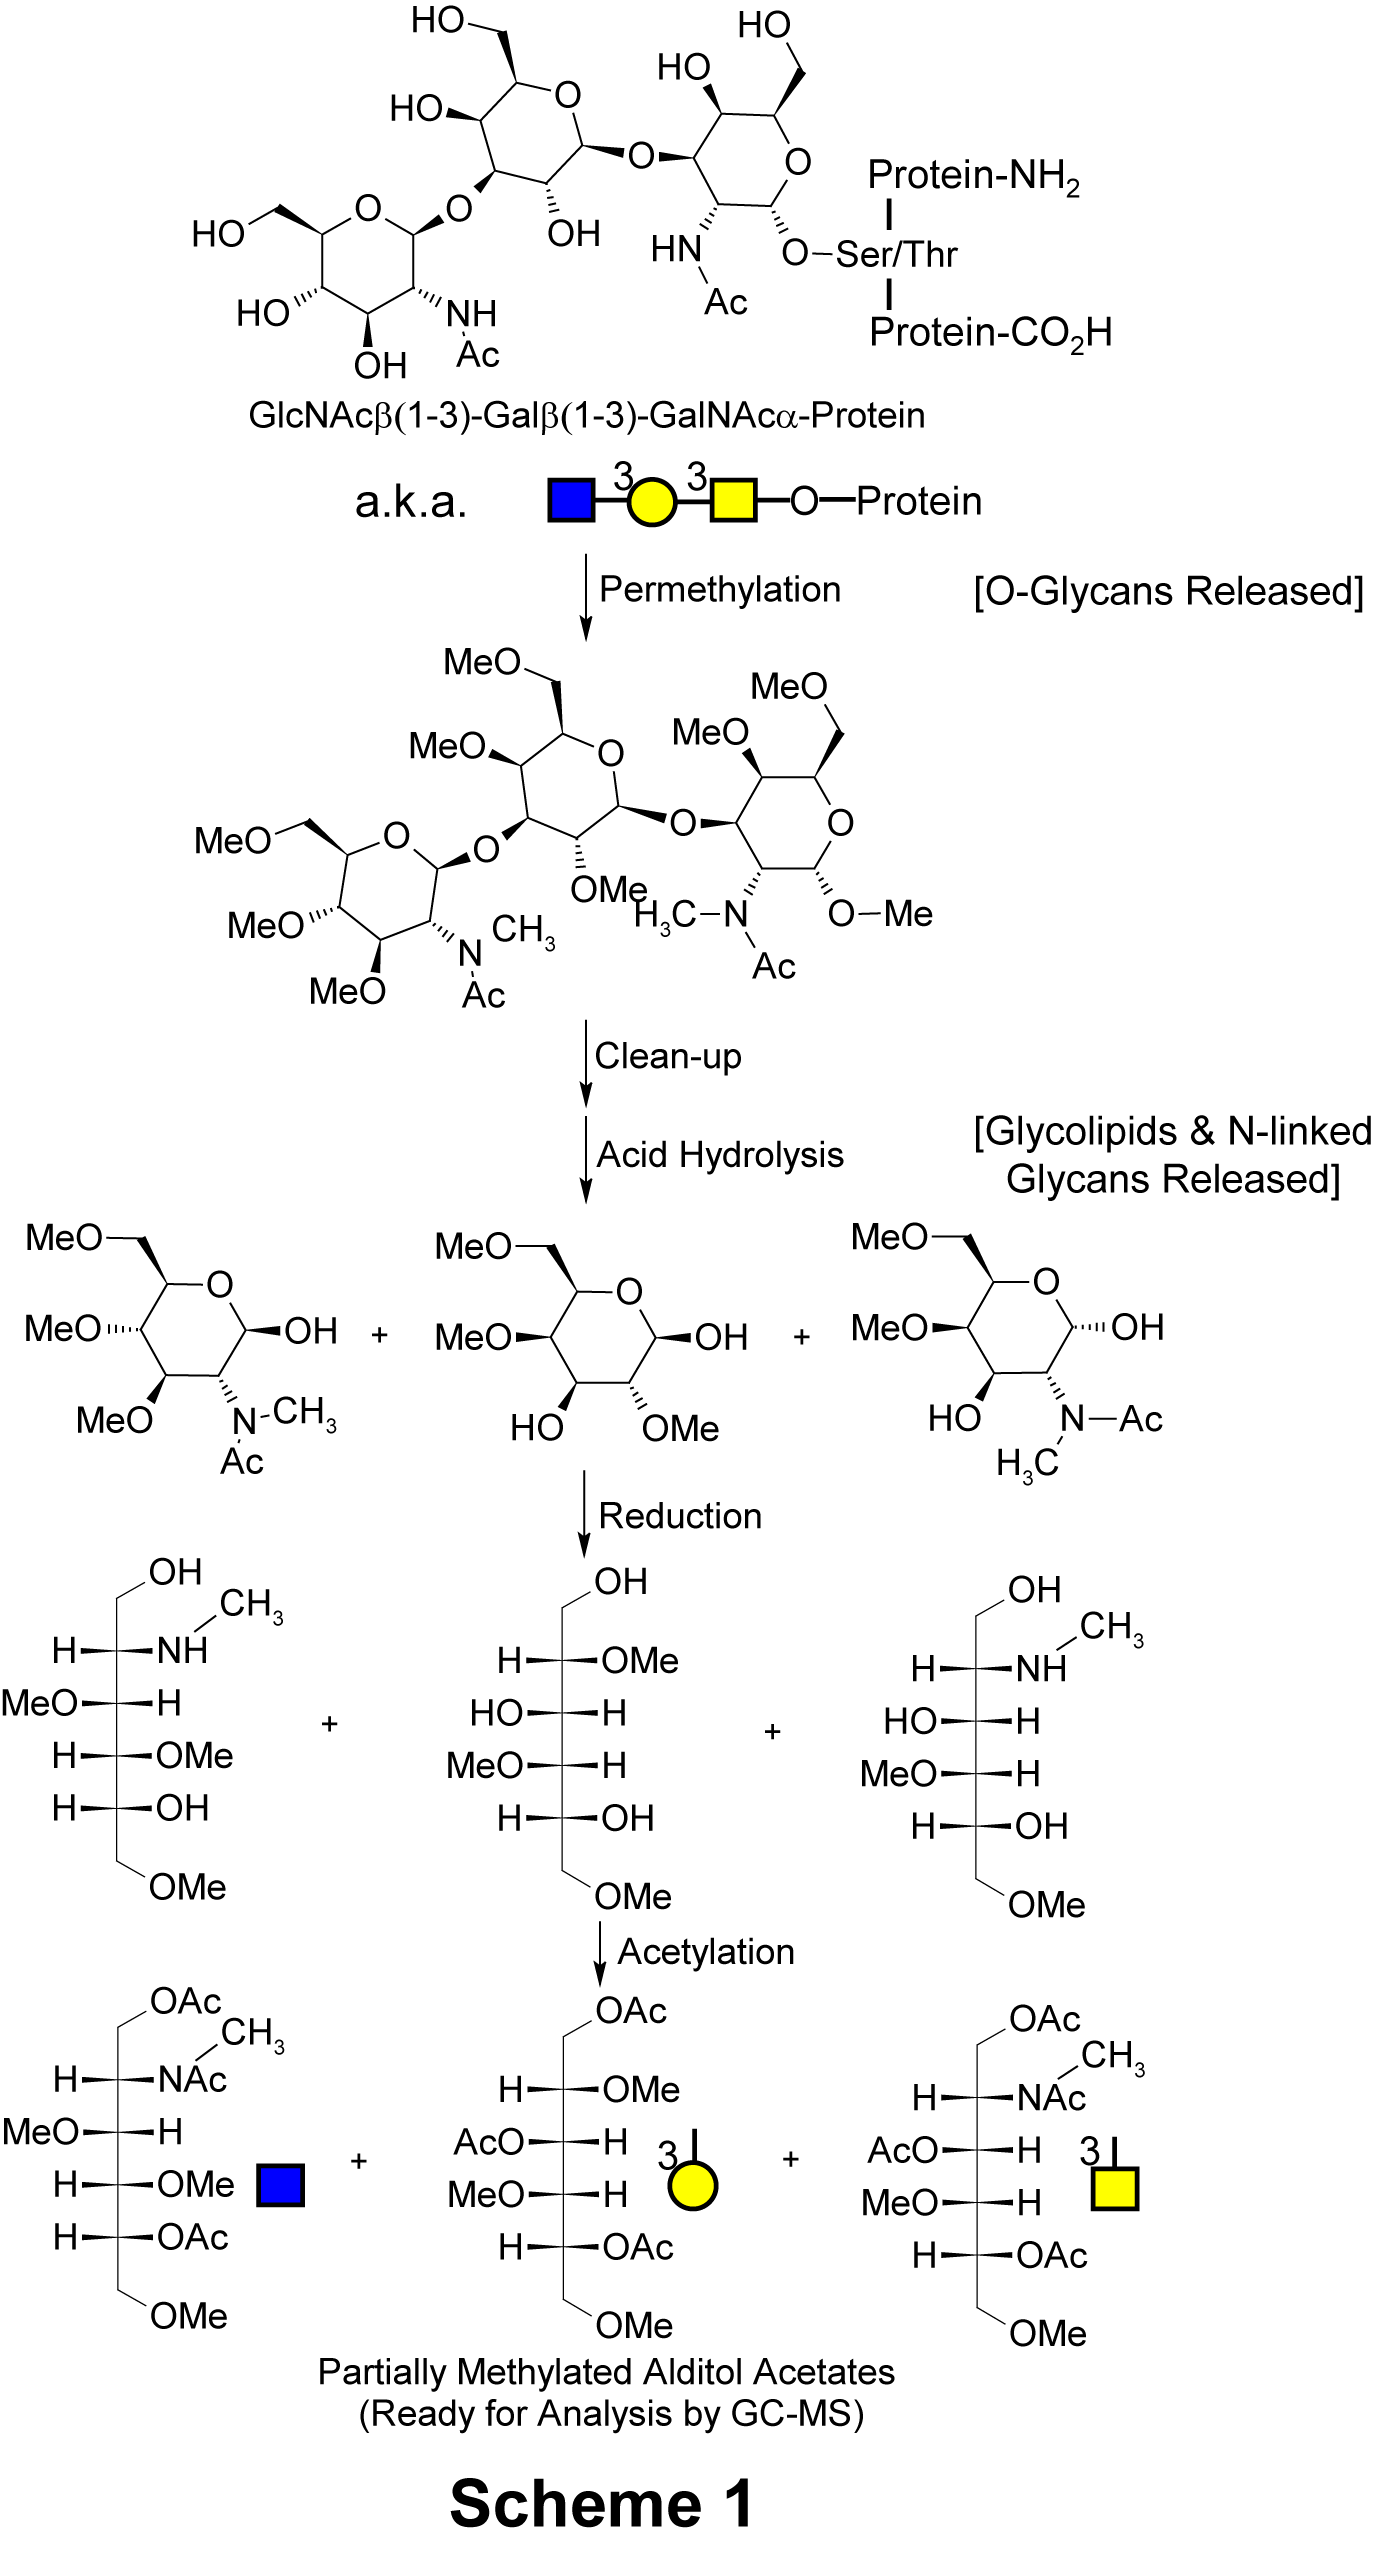
Whole biospecimens such as blood plasma, serum, urine, saliva or homogenized tissues are treated with a series of harsh but carefully designed chemical steps that break down all major classes of glycans within the samples in a way that conserves both monosaccharide composition and information about the way in which each monosaccharide was linked to other monosaccharides in the original glycan polymer. In short, it is a patented way of applying glycan methylation analysis (a.k.a. linkage analysis) to whole biospecimens.
Whole biospecimens such as blood plasma, serum, urine, saliva or homogenized tissues are treated with a series of harsh but carefully designed chemical steps that break down all major classes of glycans within the samples in a way that conserves both monosaccharide composition and information about the way in which each monosaccharide was linked to other monosaccharides in the original glycan polymer. In short, it is a patented way of applying glycan methylation analysis (a.k.a. linkage analysis) to whole biospecimens.
As shown in Scheme 1 (below) the first step is alkaline permethylation. This replaces all hydrogen atoms attached to oxygen or nitrogen atoms with methyl groups. Organic solvent is then used to extract the permethylated glycans from other sample components. Next, the glycans are heated in acid to break them apart into their constituent monosaccharides. Notice that following this step there are now "hydroxyl" functional groups (‑OH) at monosaccharide positions at which there were linkages in the original glycan polymer. These monomers are then treated with an electron-donating agent (i.e., chemically reduced) which serves to ultimately simplify the final chromatographic analysis. Finally, the hydroxyl groups are acetylated to make them readily volatile for analysis by a gas chromatograph coupled to a mass spectrometer (GC‑MS).
As shown in Scheme 1 (right) the first step is alkaline permethylation. This replaces all hydrogen atoms attached to oxygen or nitrogen atoms with methyl groups. Organic solvent is then used to extract the permethylated glycans from other sample components. Next, the glycans are heated in acid to break them apart into their constituent monosaccharides. Notice that following this step there are now "hydroxyl" functional groups (‑OH) at monosaccharide positions at which there were linkages in the original glycan polymer. These monomers are then treated with an electron-donating agent (i.e., chemically reduced) which serves to ultimately simplify the final chromatographic analysis. Finally, the hydroxyl groups are acetylated to make them readily volatile for analysis by a gas chromatograph coupled to a mass spectrometer (GC‑MS).
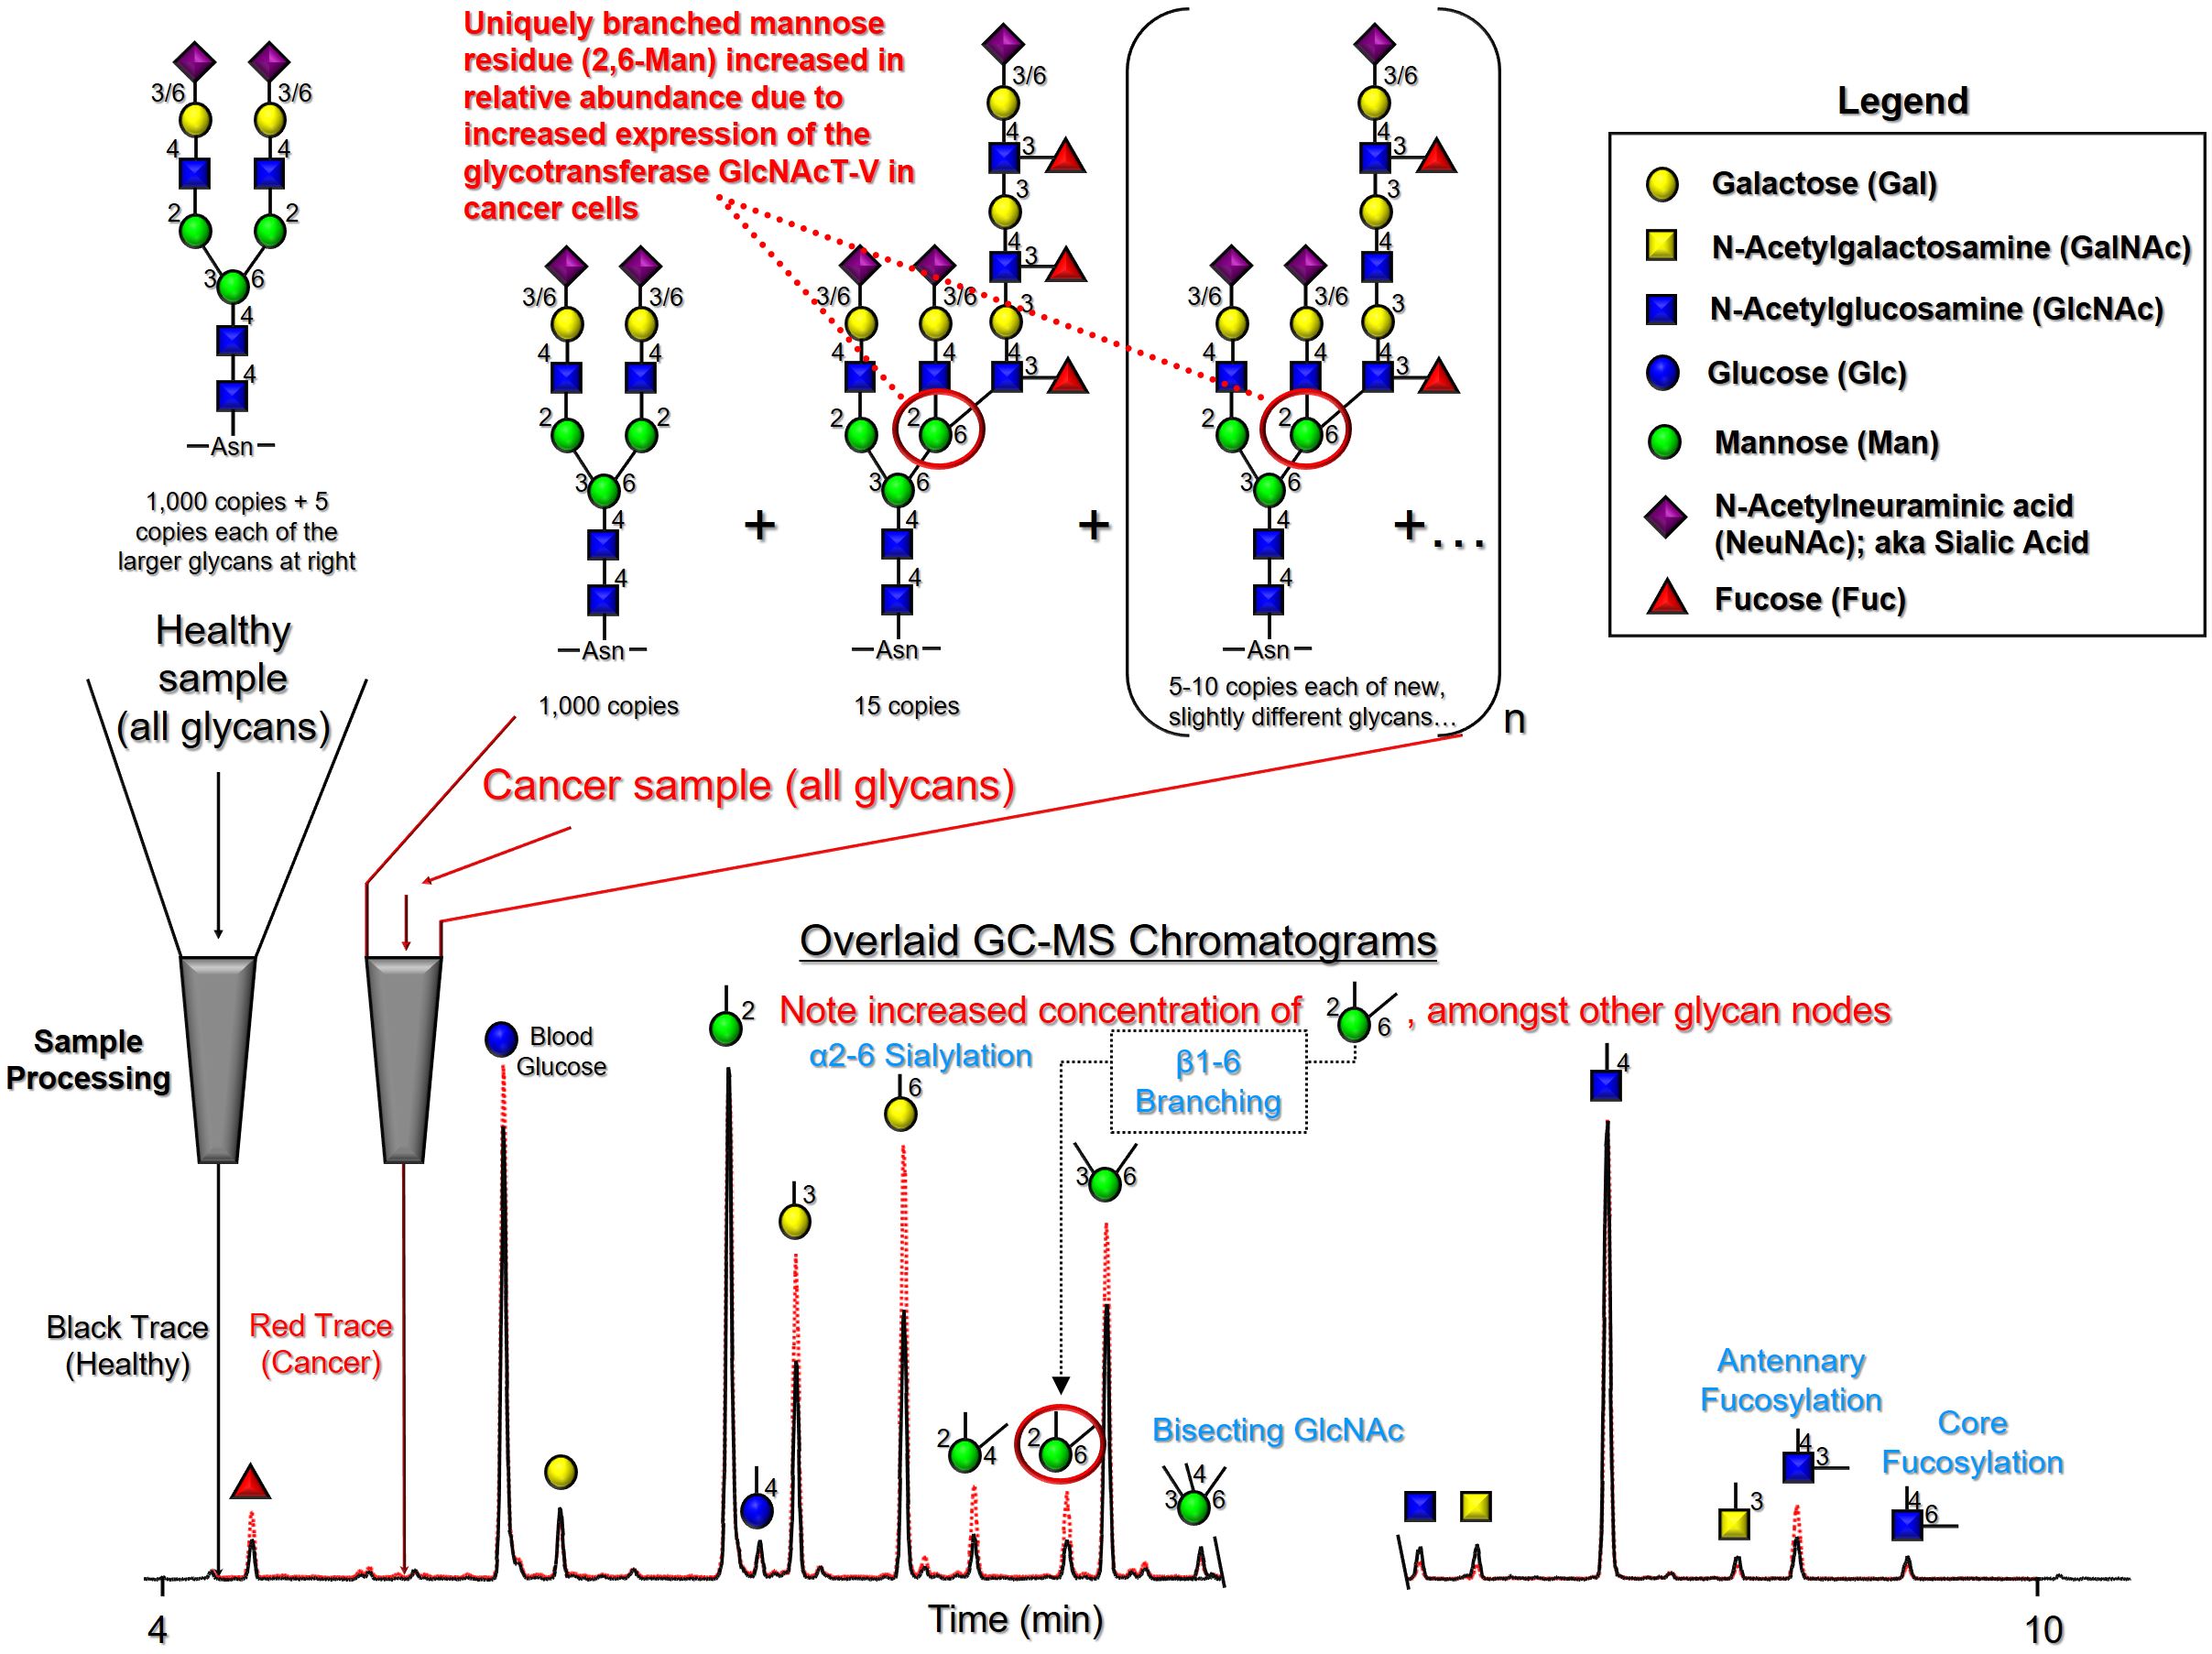
Glycan node analysis readily identifies unique glycan features from all major classes of glycans that are increased or decreased in certain disease states. An overview of how this works is shown in the figure below. Here, extracted ion chromatograms with glycan node signals from blood plasma of a healthy donor and that of a lung cancer patient are overlaid‑‑illustrating how the expression of numerous glycan nodes is altered in cancer‑‑making them potentially useful as both diagnostic and prognostic tools.
Figure Note: The light blue chromatogram annotation in this figure denotes the common names of unique glycan features. Numbers indicated are correct as the first number in the light blue annotation corresponds to the connection position of unshown monomers linked to the displayed node in the original polymer.
Glycan node analysis readily identifies unique glycan features from all major classes of glycans that are increased or decreased in certain disease states. An overview of how this works is shown in this figure. Here, extracted ion chromatograms with glycan node signals from blood plasma of a healthy donor and that of a lung cancer patient are overlaid‑‑illustrating how the expression of numerous glycan nodes is altered in cancer‑‑making them potentially useful as both diagnostic and prognostic tools.
Figure Note: The light blue chromatogram annotation in this figure denotes the common names of unique glycan features. Numbers indicated are correct as the first number in the light blue annotation corresponds to the connection position of unshown monomers linked to the displayed node in the original polymer.
It is well known that cancer causes changes in the way in which cells glycosylate their proteins. In addition, cancer cells arising from a wide variety of tissue types produce molecular signals that are picked up by both a nominally healthy liver and immune system, causing them to alter the way in which they glycosylate the proteins they secrete. Since together, the liver and immune system produce the overwhelming majority of glycosylated proteins in blood, the presence of cancer in the body can result in major changes in blood glycan profiles. Glycan node analysis can readily detect these changes.
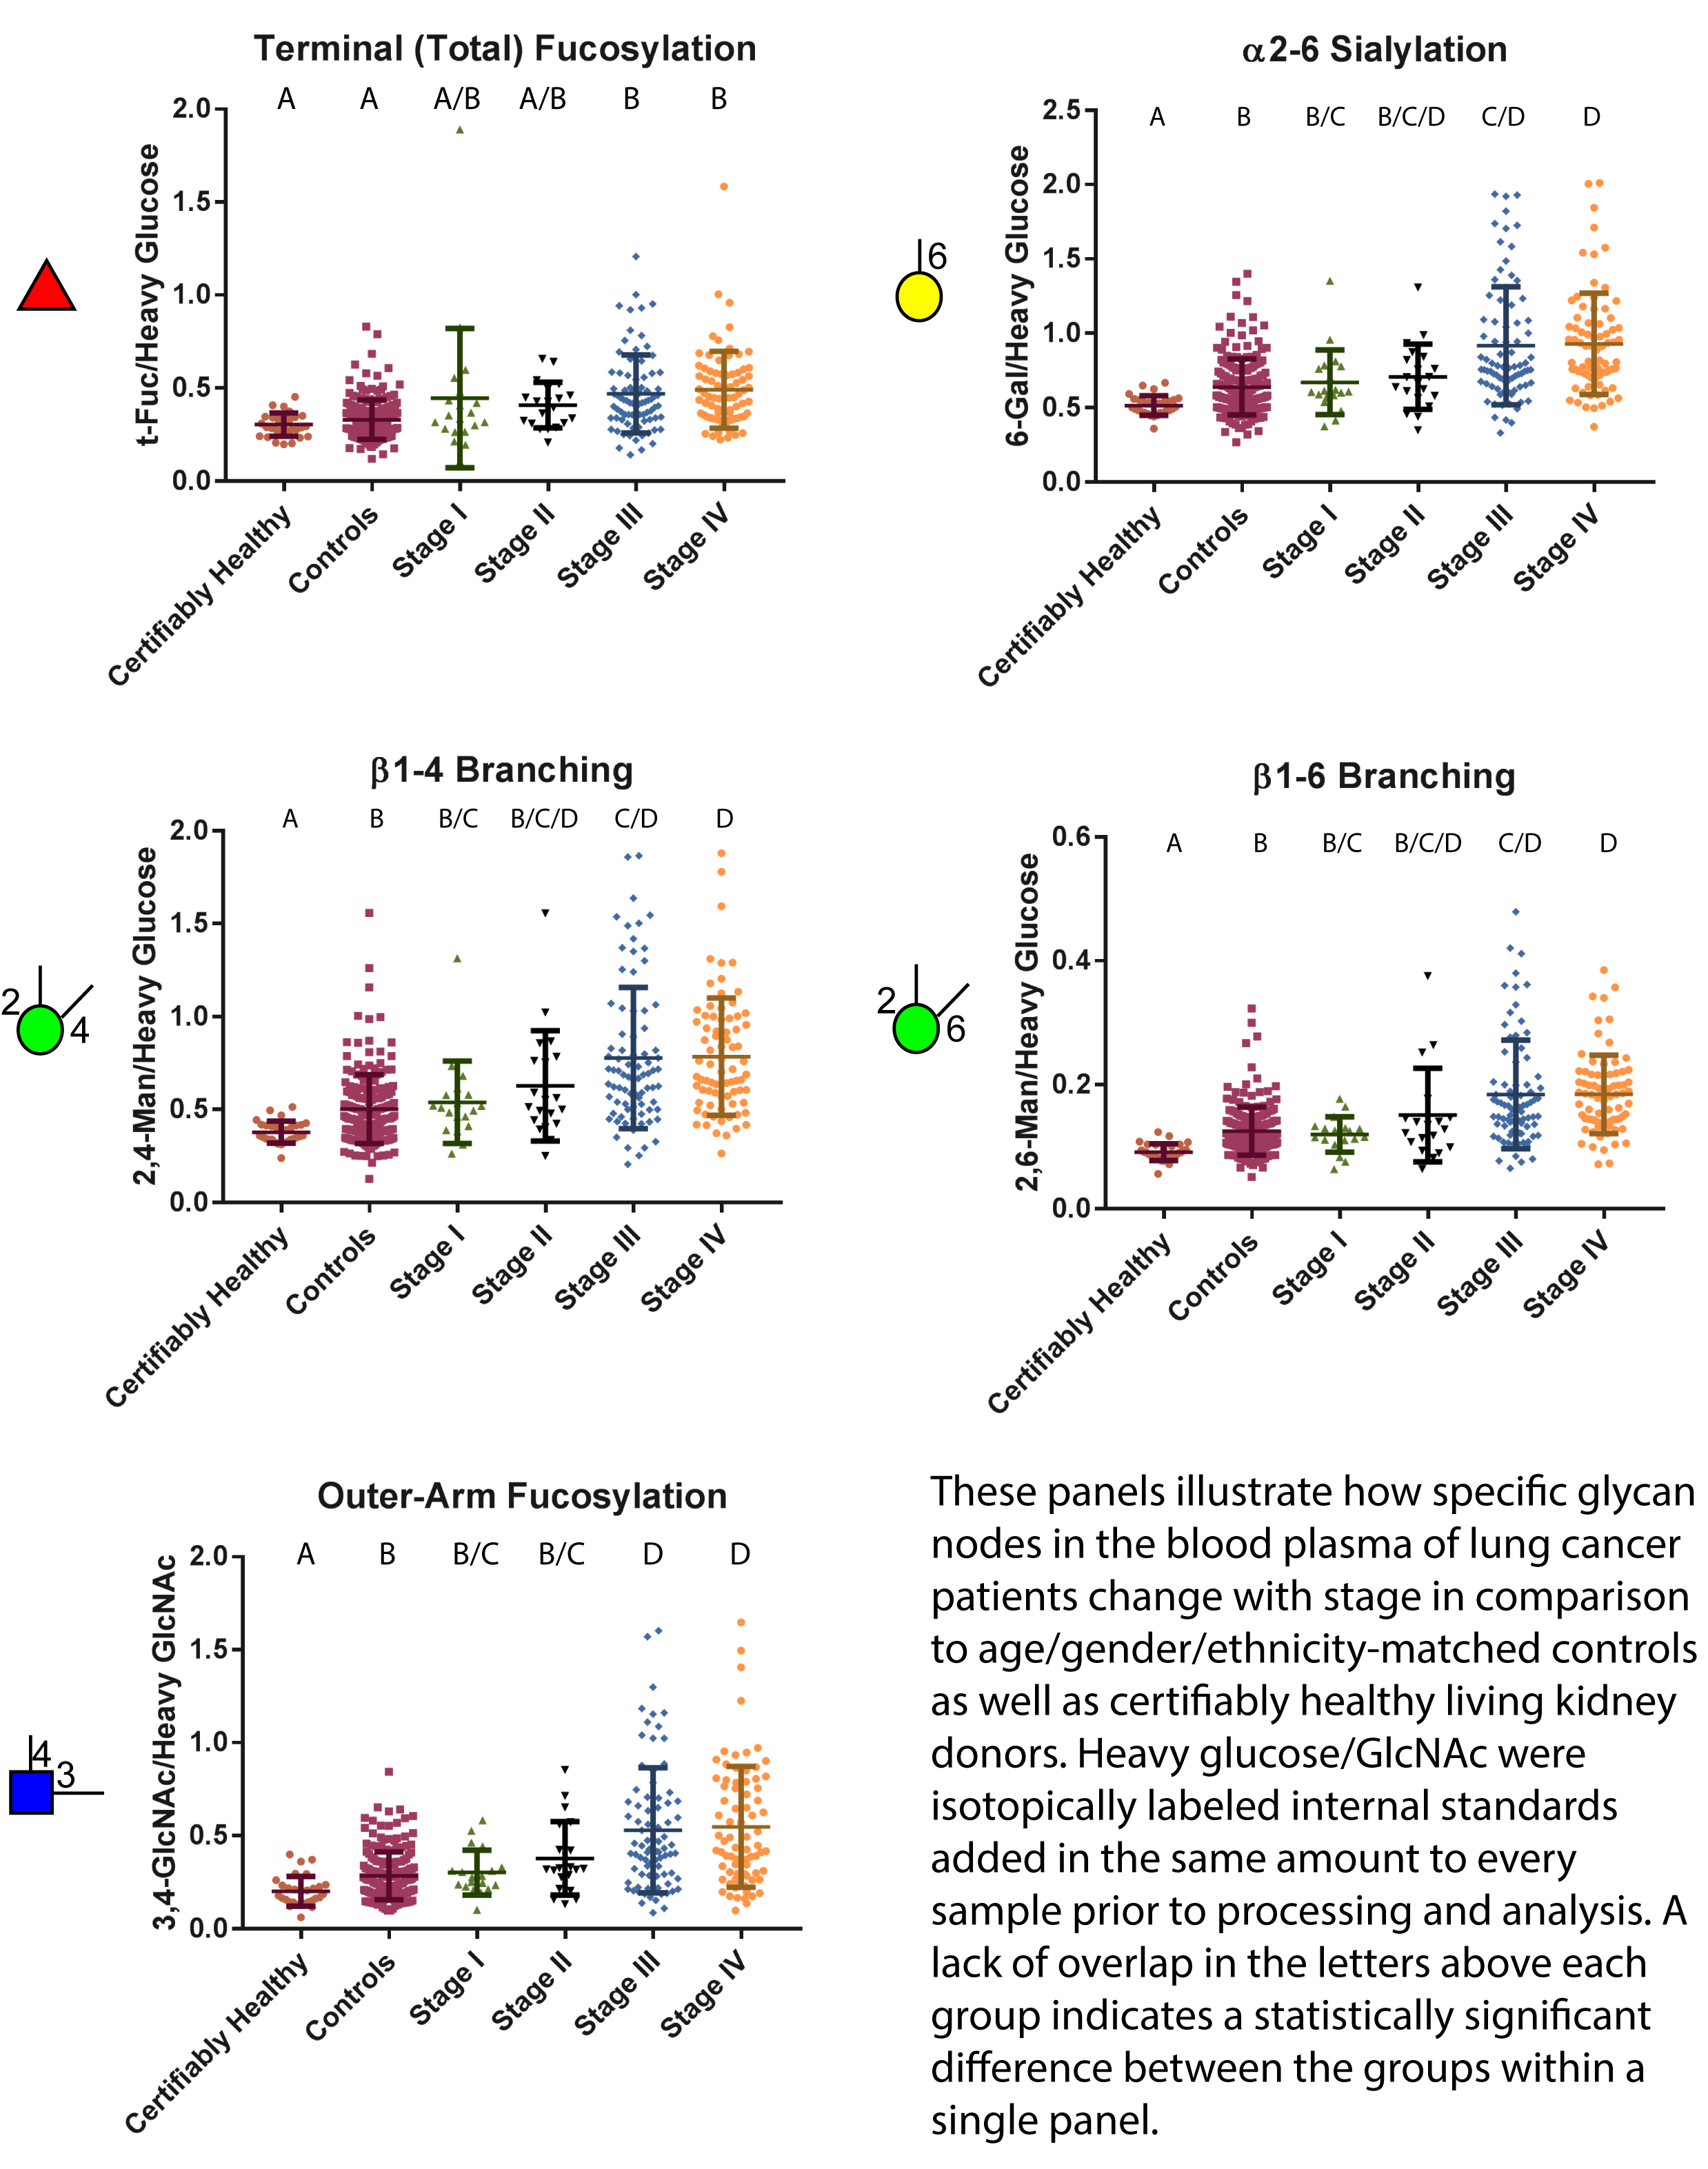
The figure below illustrates how specific glycan nodes in blood plasma increase in lung cancer patients and therefore can be used to detect the presence of lung cancer when they are at elevated levels not observed in cancer-free individuals. In this study, glycan nodes were analyzed in ten microliters (less than a drop) of blood plasma from each patient in a large group of lung cancer patients, age/gender/ethnicity matched cancer-free control donors, and certifiably healthy living kidney donors. (Technically inclined readers may view the corresponding receiver operating characteristic (ROC) curves here.)
There are two notable features in this figure. First, the level of each glycan node clearly exhibits stage dependency. This is common for nearly all cancer biomarkers (making cancer difficult to detect early) and was found to hold true for a variety of different types of cancer. Second, certifiably healthy individuals have lower levels of four of the five glycan nodes shown. To quote from our 2018 paper in which these results were published, " The notable differences between healthy individuals and at-risk controls... support the idea that the biological landscape within plasma and serum may undergo 'grooming', 'conditioning', or premetastatic 'niche' formation prior to cancer taking hold within the body. Given that inflammation is closely tied to the development of cancer and that at least some glycans and glycan features are known to be altered in inflammatory conditions in the absence of cancer, precancerous inflammation may be responsible for the elevation of many of the glycan features observed in the at-risk controls relative to the certifiably healthy living kidney donors, suggesting that the goal of preventing such a precancerous state may be as important as preventing the transition from an at-risk state to stage I cancer. With this in mind, it is interesting to note that about 62% of the age-qualified U.S. population would be excluded as living kidney donors due to preventable health conditions.
It is well known that cancer causes changes in the way in which cells glycosylate their proteins. In addition, cancer cells arising from a wide variety of tissue types produce molecular signals that are picked up by both a nominally healthy liver and immune system, causing them to alter the way in which they glycosylate the proteins they secrete. Since together, the liver and immune system produce the overwhelming majority of glycosylated proteins in blood, the presence of cancer in the body can result in major changes in blood glycan profiles. Glycan node analysis can readily detect these changes.
The figure at right illustrates how specific glycan nodes in blood plasma increase in lung cancer patients and therefore can be used to detect the presence of lung cancer when they are at elevated levels not observed in cancer-free individuals. In this study, glycan nodes were analyzed in ten microliters (less than a drop) of blood plasma from each patient in a large group of lung cancer patients, age/gender/ethnicity matched cancer-free control donors, and certifiably healthy living kidney donors. (Technically inclined readers may view the corresponding receiver operating characteristic (ROC) curves here.)
There are two notable features in this figure. First, the level of each glycan node clearly exhibits stage dependency. This is common for nearly all cancer biomarkers (making cancer difficult to detect early) and was found to hold true for a variety of different types of cancer. Second, certifiably healthy individuals have lower levels of four of the five glycan nodes shown. To quote from our 2018 paper in which these results were published, "The notable differences between healthy individuals and at-risk controls... support the idea that the biological landscape within plasma and serum may undergo 'grooming', 'conditioning', or premetastatic 'niche' formation prior to cancer taking hold within the body. Given that inflammation is closely tied to the development of cancer and that at least some glycans and glycan features are known to be altered in inflammatory conditions in the absence of cancer, precancerous inflammation may be responsible for the elevation of many of the glycan features observed in the at-risk controls relative to the certifiably healthy living kidney donors, suggesting that the goal of preventing such a precancerous state may be as important as preventing the transition from an at-risk state to stage I cancer. With this in mind, it is interesting to note that about 62% of the age-qualified U.S. population would be excluded as living kidney donors due to preventable health conditions."
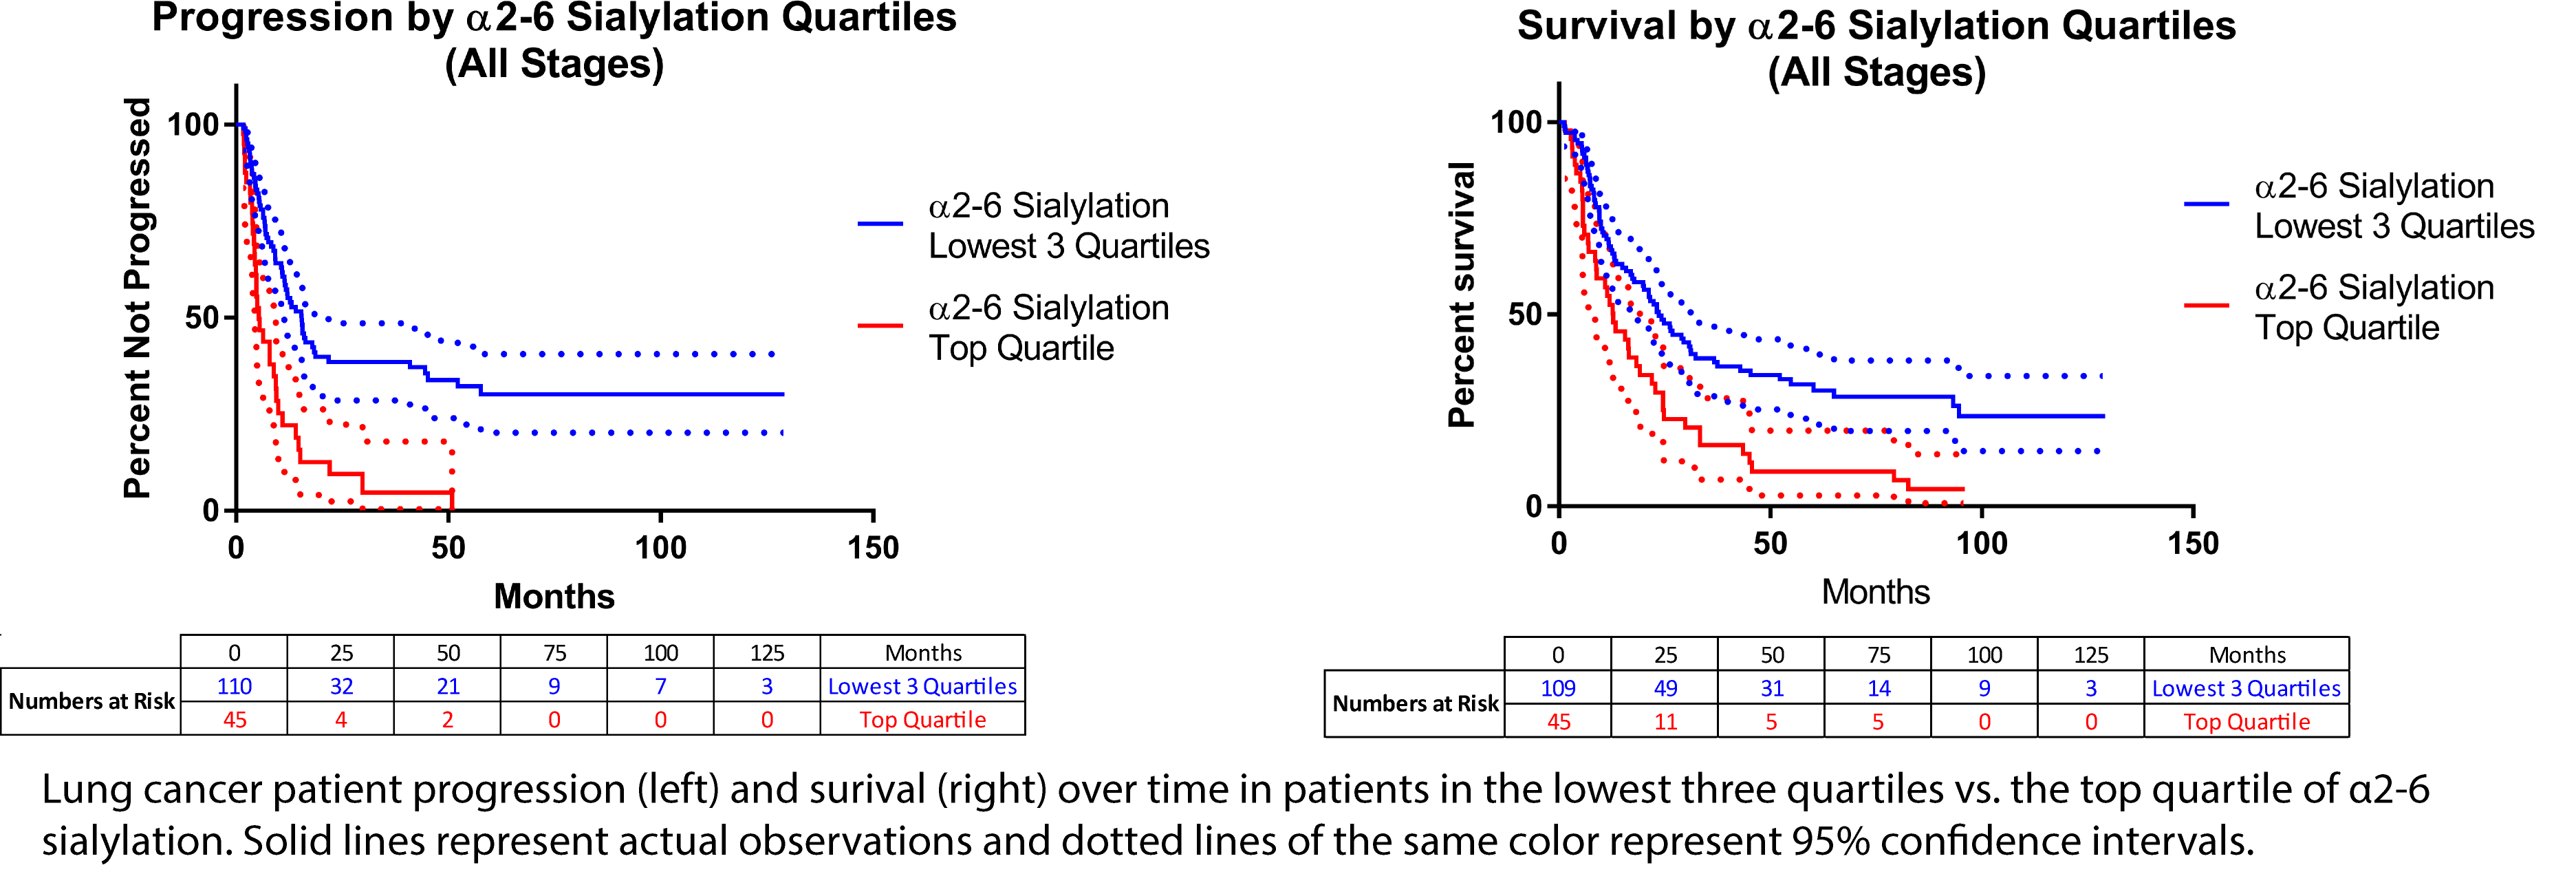
Given the striking elevation observed for several glycan nodes at advanced stages of lung cancer (see panel immediately above this one), we evaluated their ability to predict disease progression and patient survival. α2-6 Sialylation proved to be one of the most useful glycan nodes in this regard. Plots of patient progression and surival for individuals in the lowest three quartiles vs. those in the top quartile of α2-6 sialylation are shown in the figure below. Patients in the top quartile exhibited significantly more rapid progression and lower survival than other patients. These survival prediction results have now been confirmed in an independent cohort of lung cancer patients.
Given the striking elevation observed for several glycan nodes at advanced stages of lung cancer (see panel immediately above this one), we evaluated their ability to predict disease progression and patient survival. α2-6 Sialylation proved to be one of the most useful glycan nodes in this regard. Plots of patient progression and survival for individuals in the lowest three quartiles vs. those in the top quartile of α2-6 sialylation are shown in the figure. Patients in the top quartile exhibited significantly more rapid progression and lower survival than other patients. These survival prediction results have now been confirmed in an independent cohort of lung cancer patients.
A Research Tool to Understand Extracellular Vesicle Glycomics
Blood plasma contains extracellular vesicles (EVs). EVs are membrane-enclosed, non-replicating packages of cellular material that are generally smaller than cells and appear to serve as a means of transferring biomolecules between cells and facilitating tissue-to-tissue communication. Most if not all cell types secrete EVs, but an emerging concept in biomedical research is that tumor cells secrete EVs as a means of grooming the biological landscape for the purpose of carving out a metastatic niche. If this is true, EVs secreted by cancer cells are likely to provide useful information about the presence and/or nature of their unwanted cells of origin.
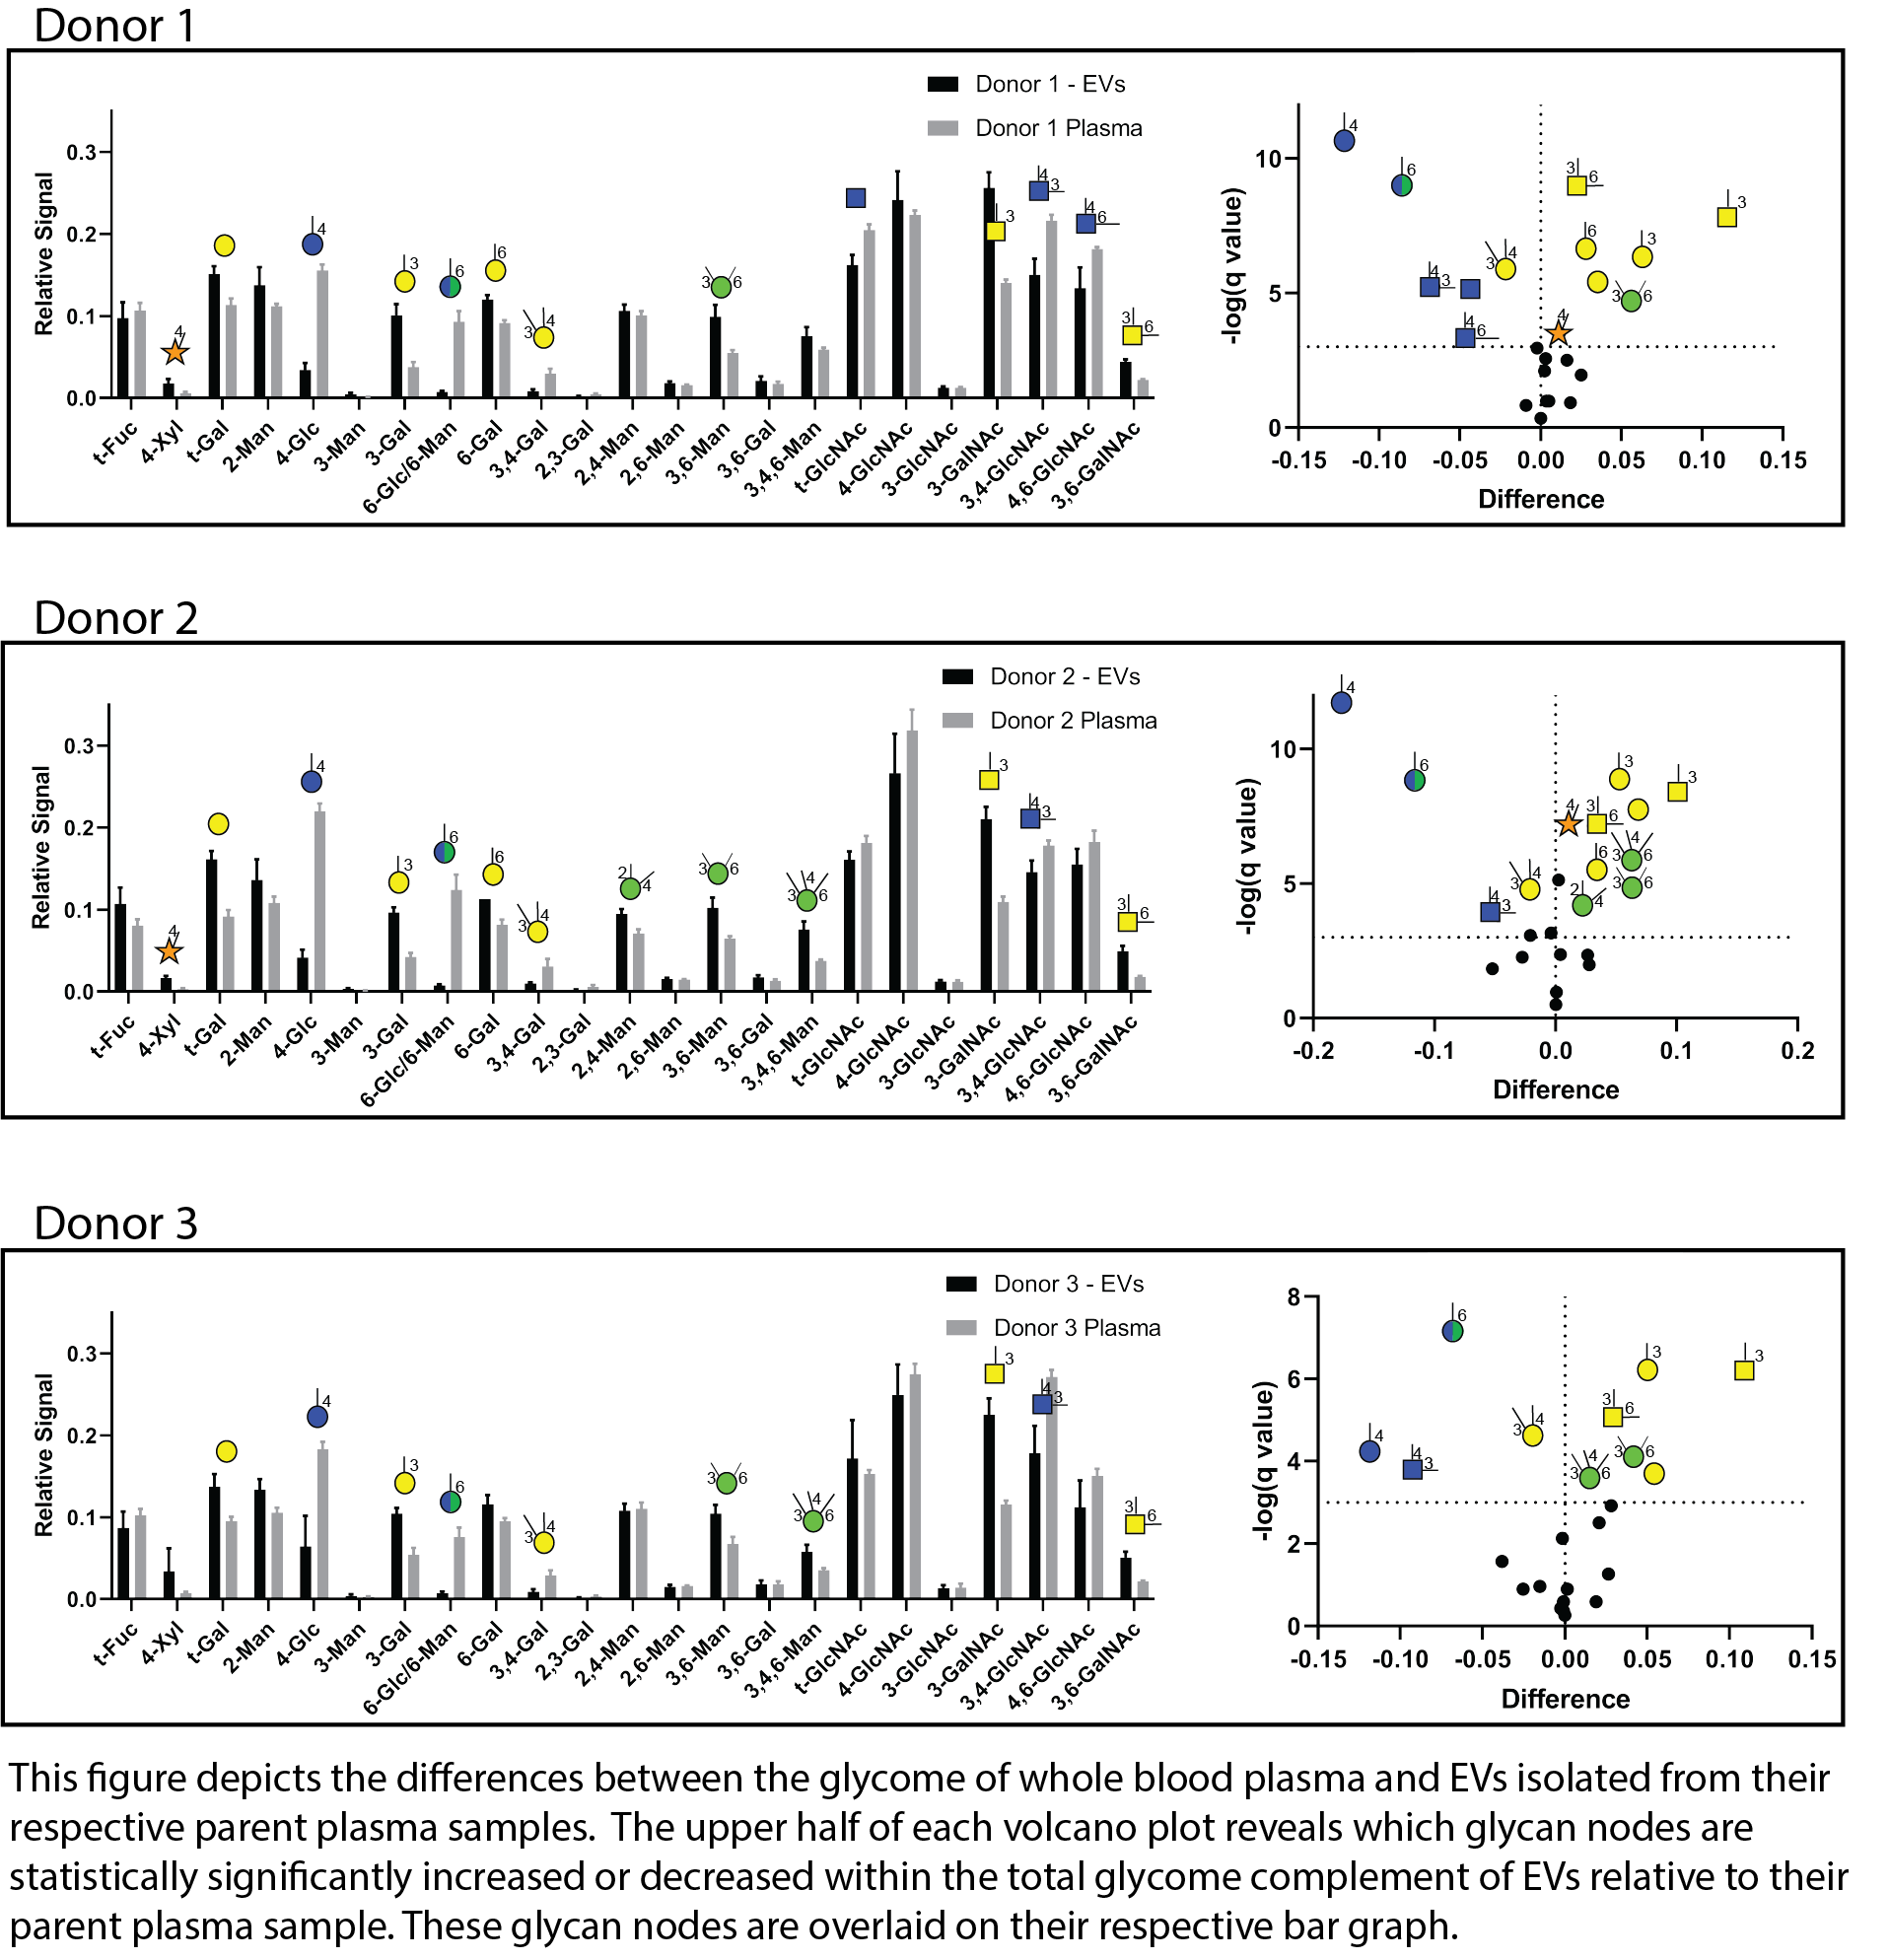
Little is known about the total glycan complement or "glycome" of the EVs that circulate in blood plasma. To better understand this glycome, our laboratory recently collaborated with Dr. Joy Wolfram and her lab at the Mayo Clinic Florida to compare the glycan node composition of whole blood plasma from three different donors with that of EVs isolated from their parent plasma samples. Results (shown in the figure below) indicate that plasma EVs are enriched in long, linear carbohydrate polymers known as glycosaminoglycans (GAGs) (and their associated proteoglycans) relative to the glycome of whole plasma. The implications of this finding have yet to be elucidated.
For an explanation of the volcano plots shown in this figure, click here.
Blood plasma contains extracellular vesicles (EVs). EVs are membrane-enclosed, non-replicating packages of cellular material that are generally smaller than cells and appear to serve as a means of transferring biomolecules between cells and facilitating tissue-to-tissue communication. Most if not all cell types secrete EVs, but an emerging concept in biomedical research is that tumor cells secrete EVs as a means of grooming the biological landscape for the purpose of carving out a metastatic niche. If this is true, EVs secreted by cancer cells are likely to provide useful information about the presence and/or nature of their unwanted cells of origin.
Little is known about the total glycan complement or "glycome" of the EVs that circulate in blood plasma. To better understand this glycome, our laboratory recently collaborated with Dr. Joy Wolfram and her lab at the Mayo Clinic Florida to compare the glycan node composition of whole blood plasma from three different donors with that of EVs isolated from their parent plasma samples. Results (shown in the figure in this panel) indicate that plasma EVs are enriched in long, linear carbohydrate polymers known as glycosaminoglycans (GAGs) (and their associated proteoglycans) relative to the glycome of whole plasma. The implications of this finding have yet to be elucidated.
For an explanation of the volcano plots shown in this figure, click here.
Glycosylation Consistency Profiling
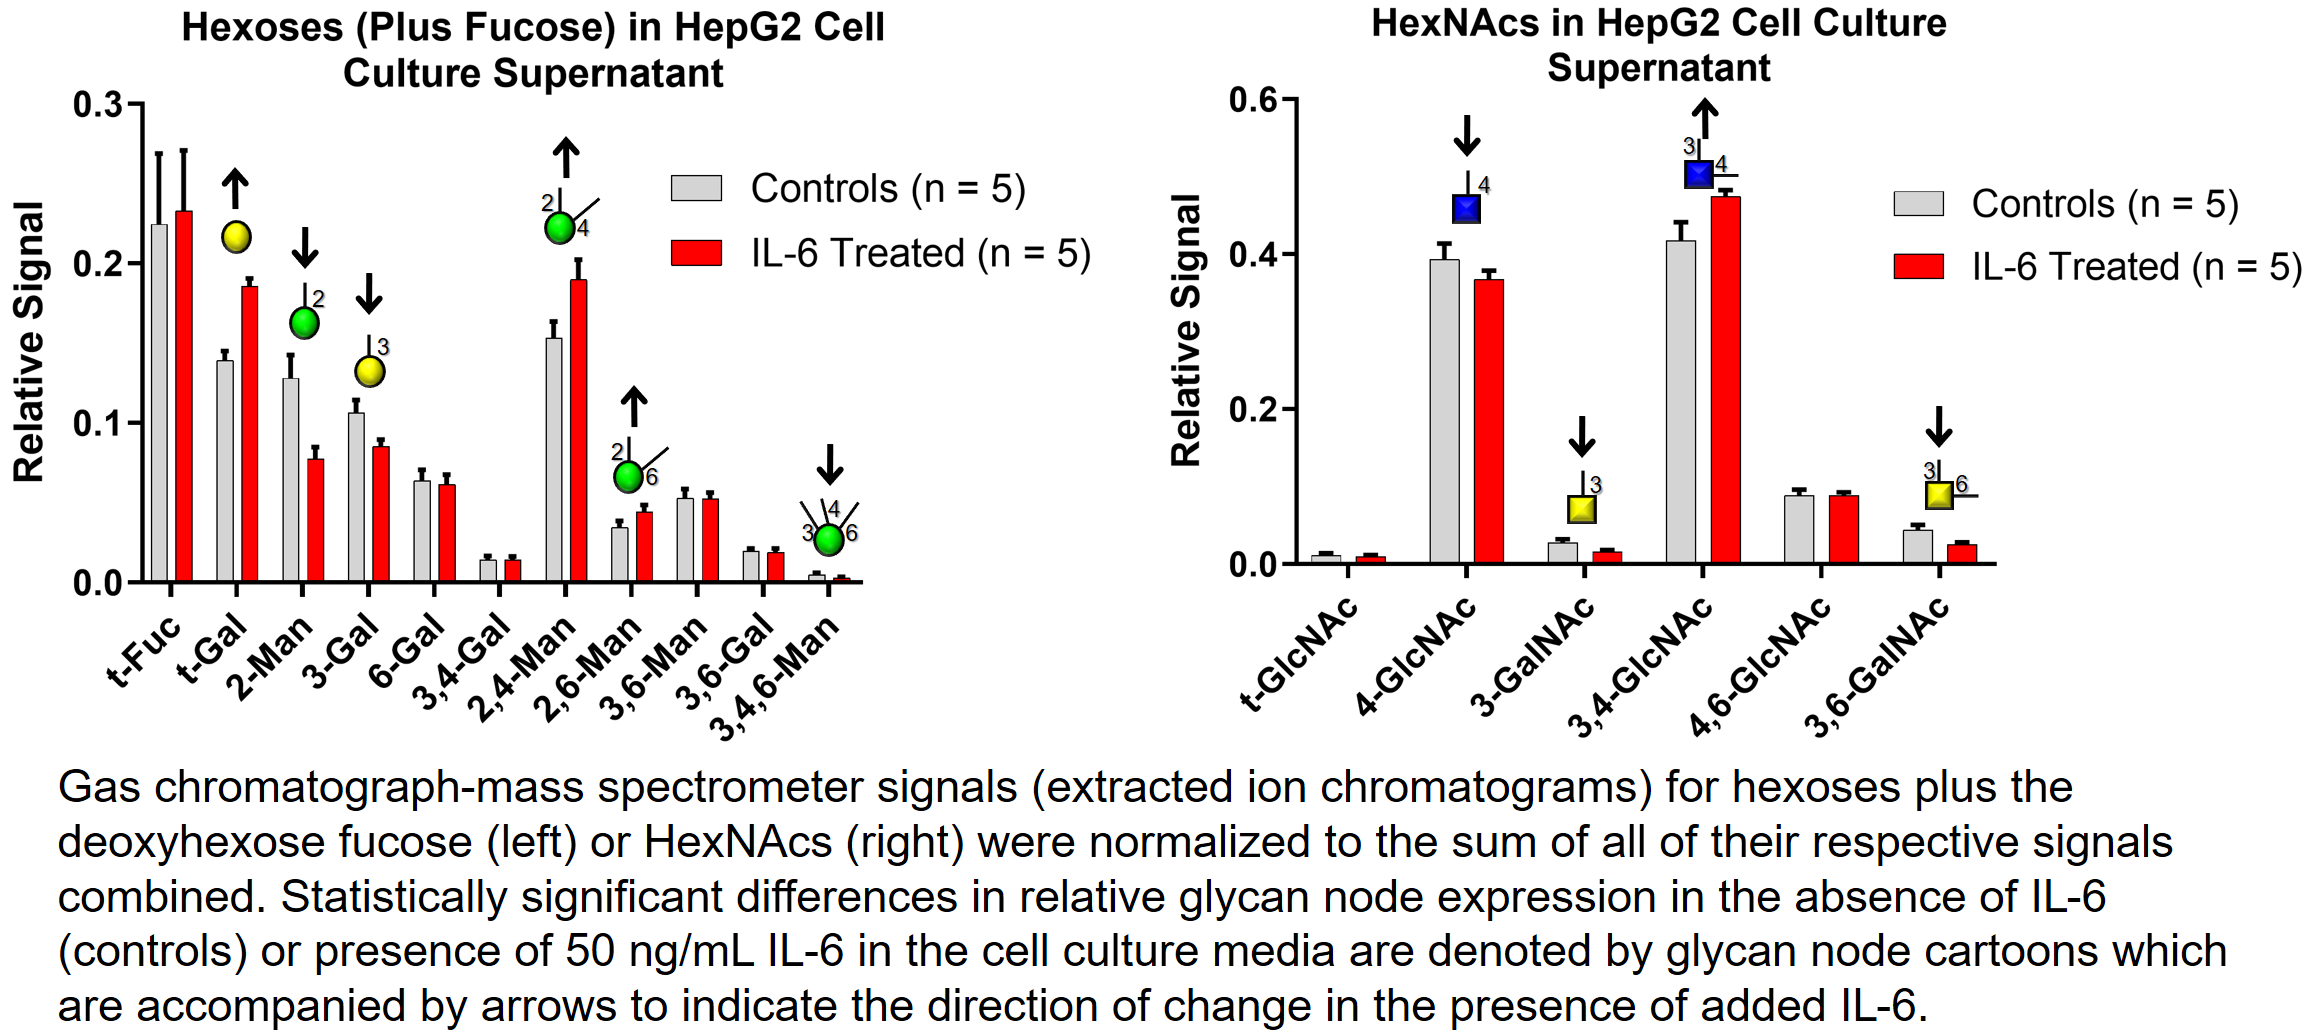
Subtle changes in cell culture conditions can alter glycosylation profiles of secreted proteins. This can create problems if, for example, the goal is to produce a glycoprotein pharmaceutical (such as a therapeutic antibody) that must be manufactured with consistent glycosylation from lot to lot. In such situations it is important to monitor glycosylation profiles on a routine basis. Glycan node analysis can be used for this purpose.
This is demonstrated at the "macro" level (all secreted proteins analyzed together) in the figure below. Here, human liver cancer cells were cultured in the absence (controls) and presence of the cytokine interleukin-6 (IL-6). This resulted in statistically significant changes in the relative expression of several glycan nodes.
Subtle changes in cell culture conditions can alter glycosylation profiles of secreted proteins. This can create problems if, for example, the goal is to produce a glycoprotein pharmaceutical (such as a therapeutic antibody) that must be manufactured with consistent glycosylation from lot to lot. In such situations it is important to monitor glycosylation profiles on a routine basis. Glycan node analysis can be used for this purpose.
This is demonstrated at the "macro" level (all secreted proteins analyzed together) in the figure in this panel. Here, human liver cancer cells were cultured in the absence (controls) and presence of the cytokine interleukin-6 (IL-6). This resulted in statistically significant changes in the relative expression of several glycan nodes.
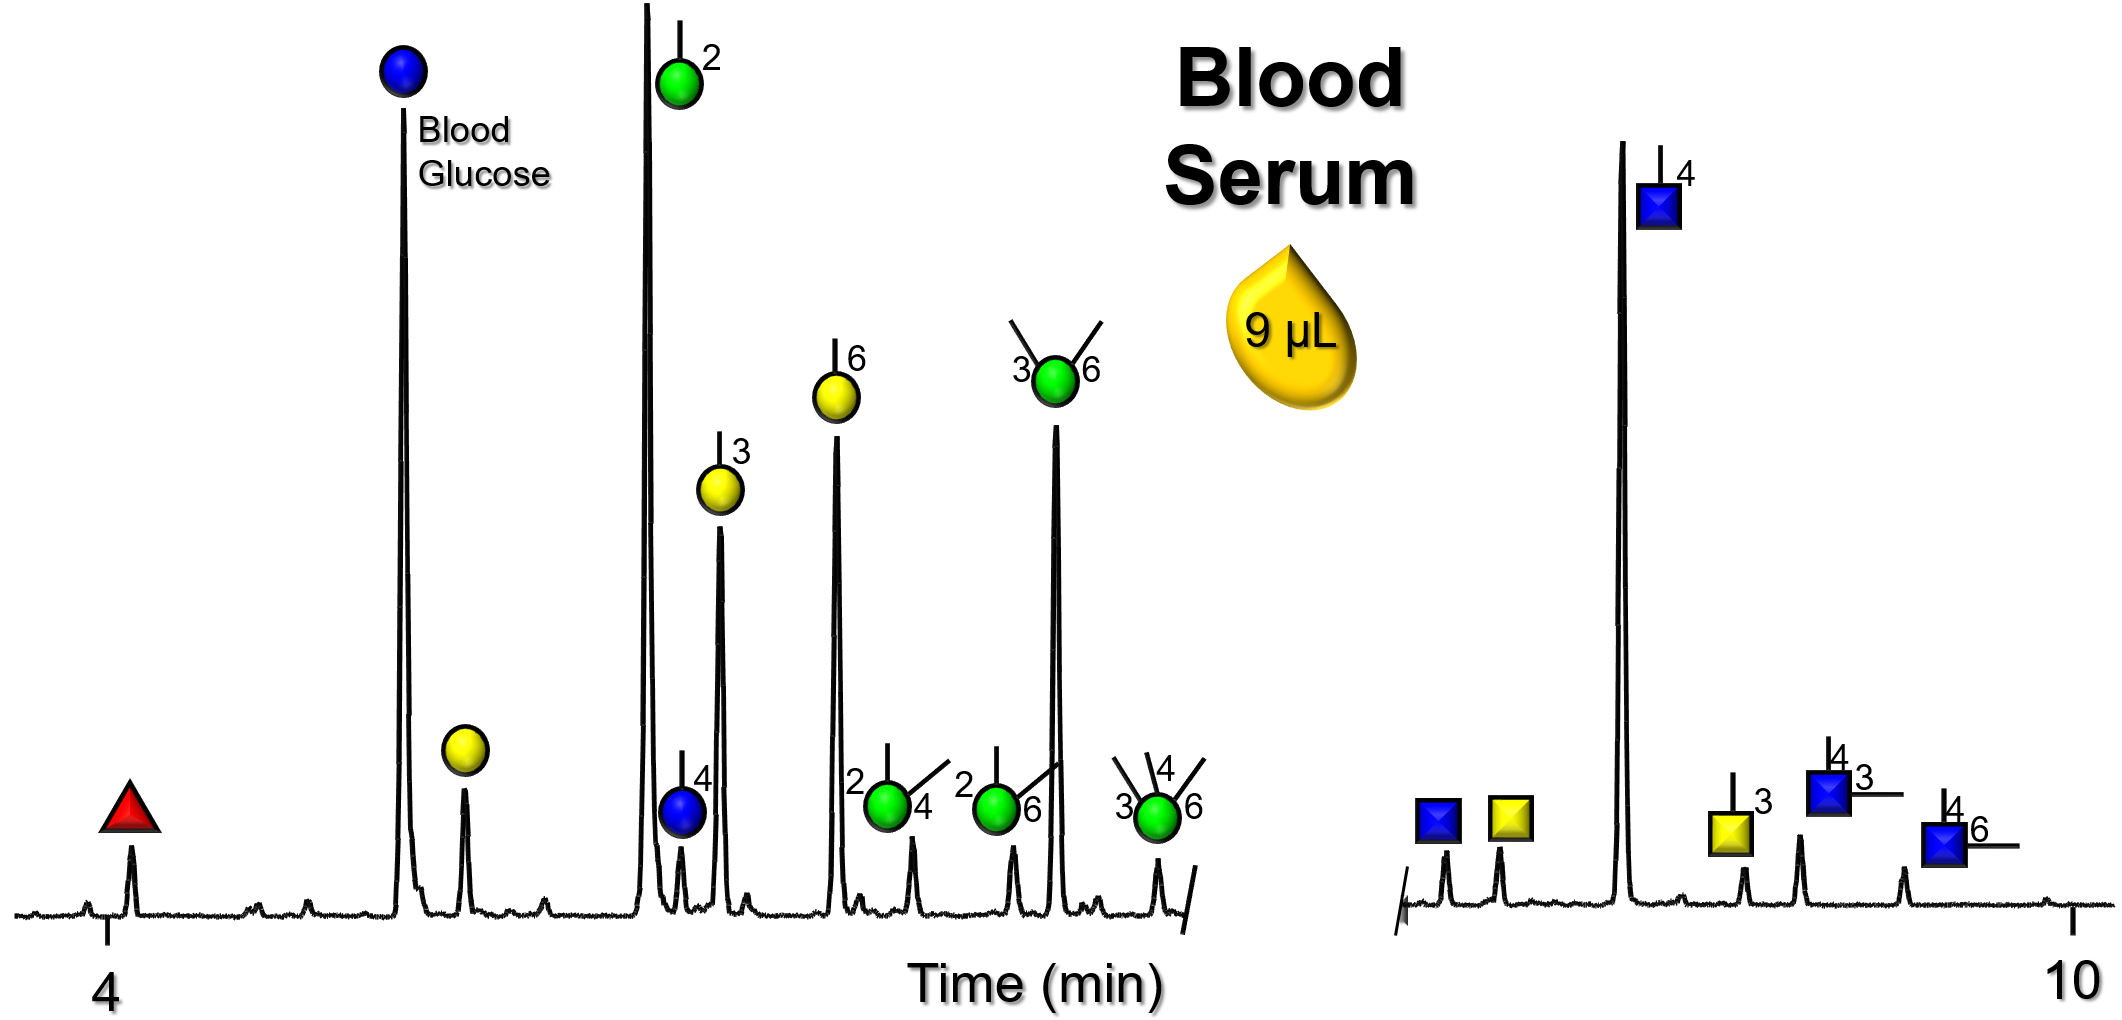
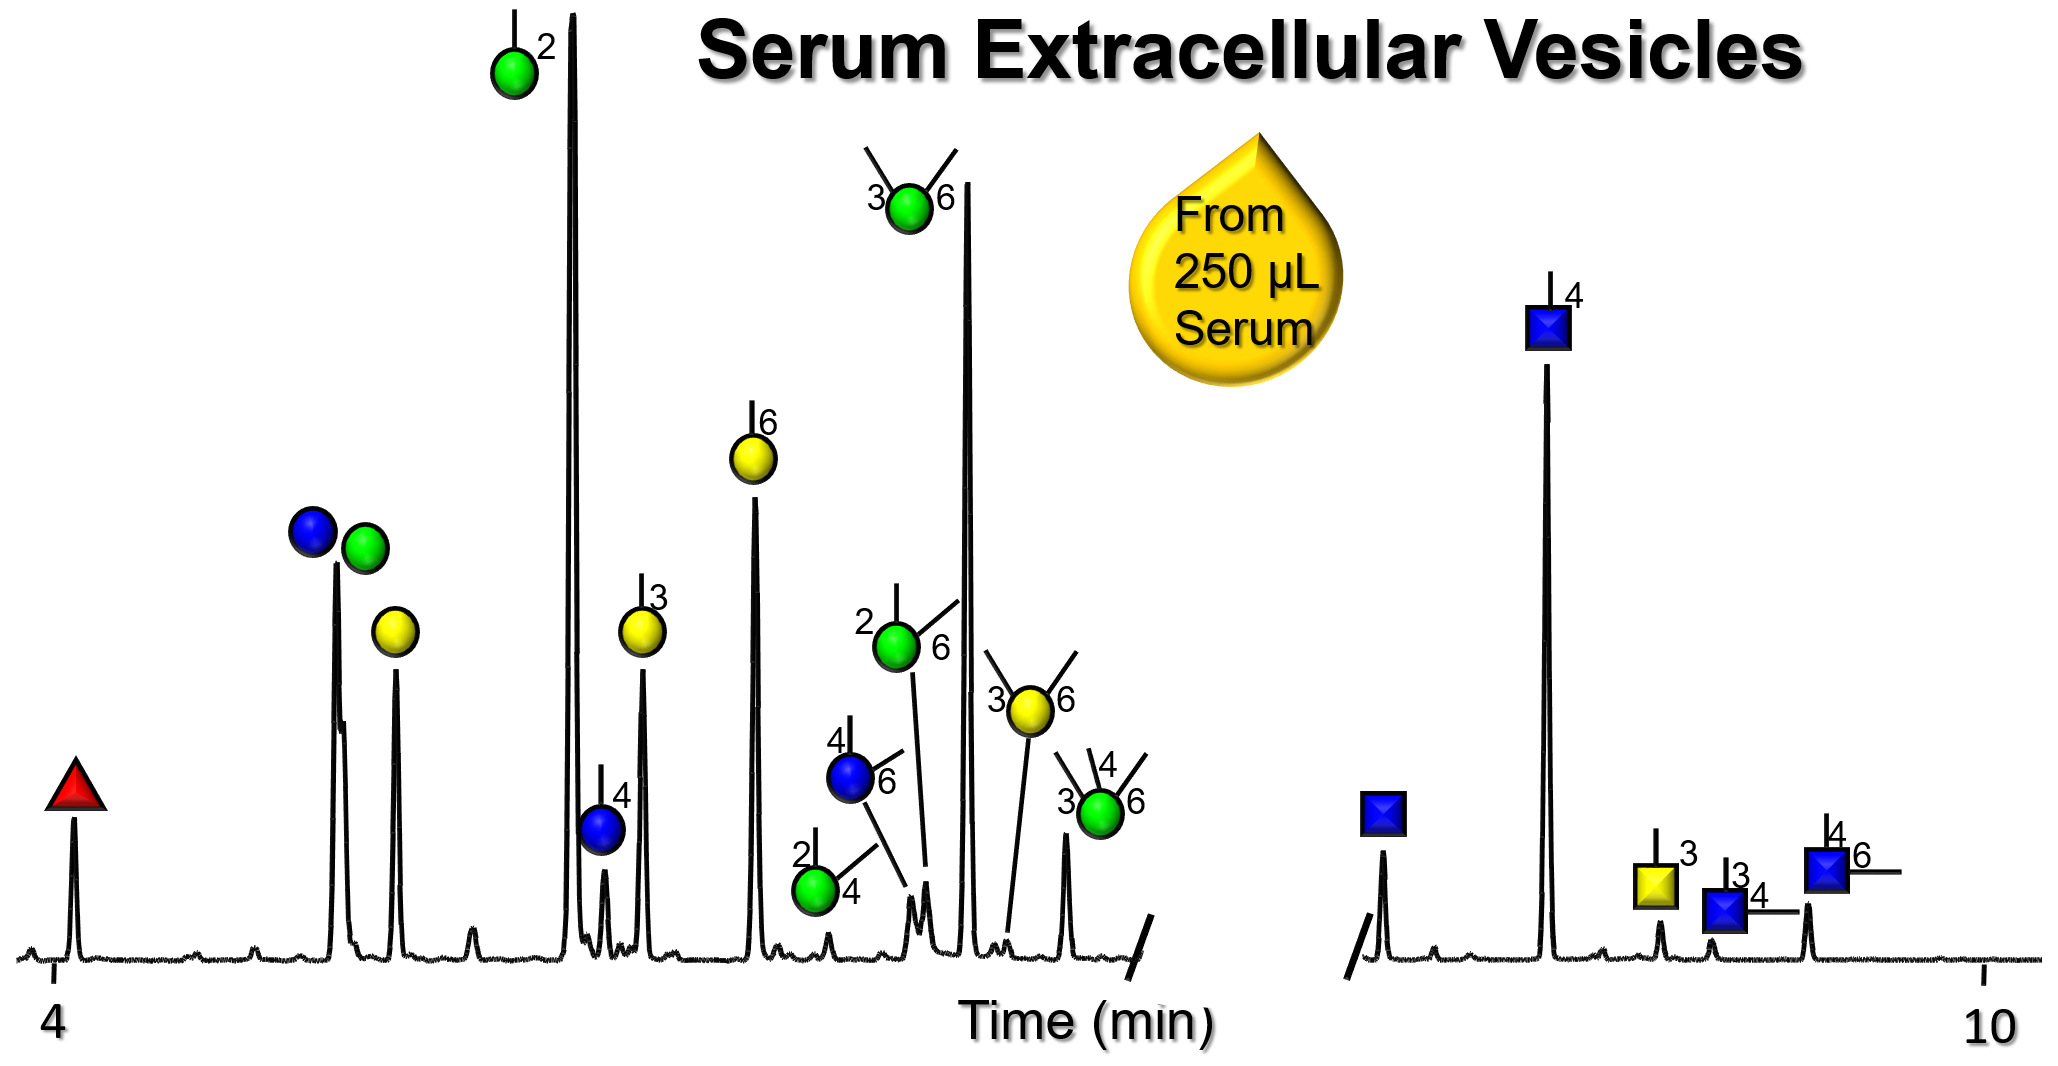
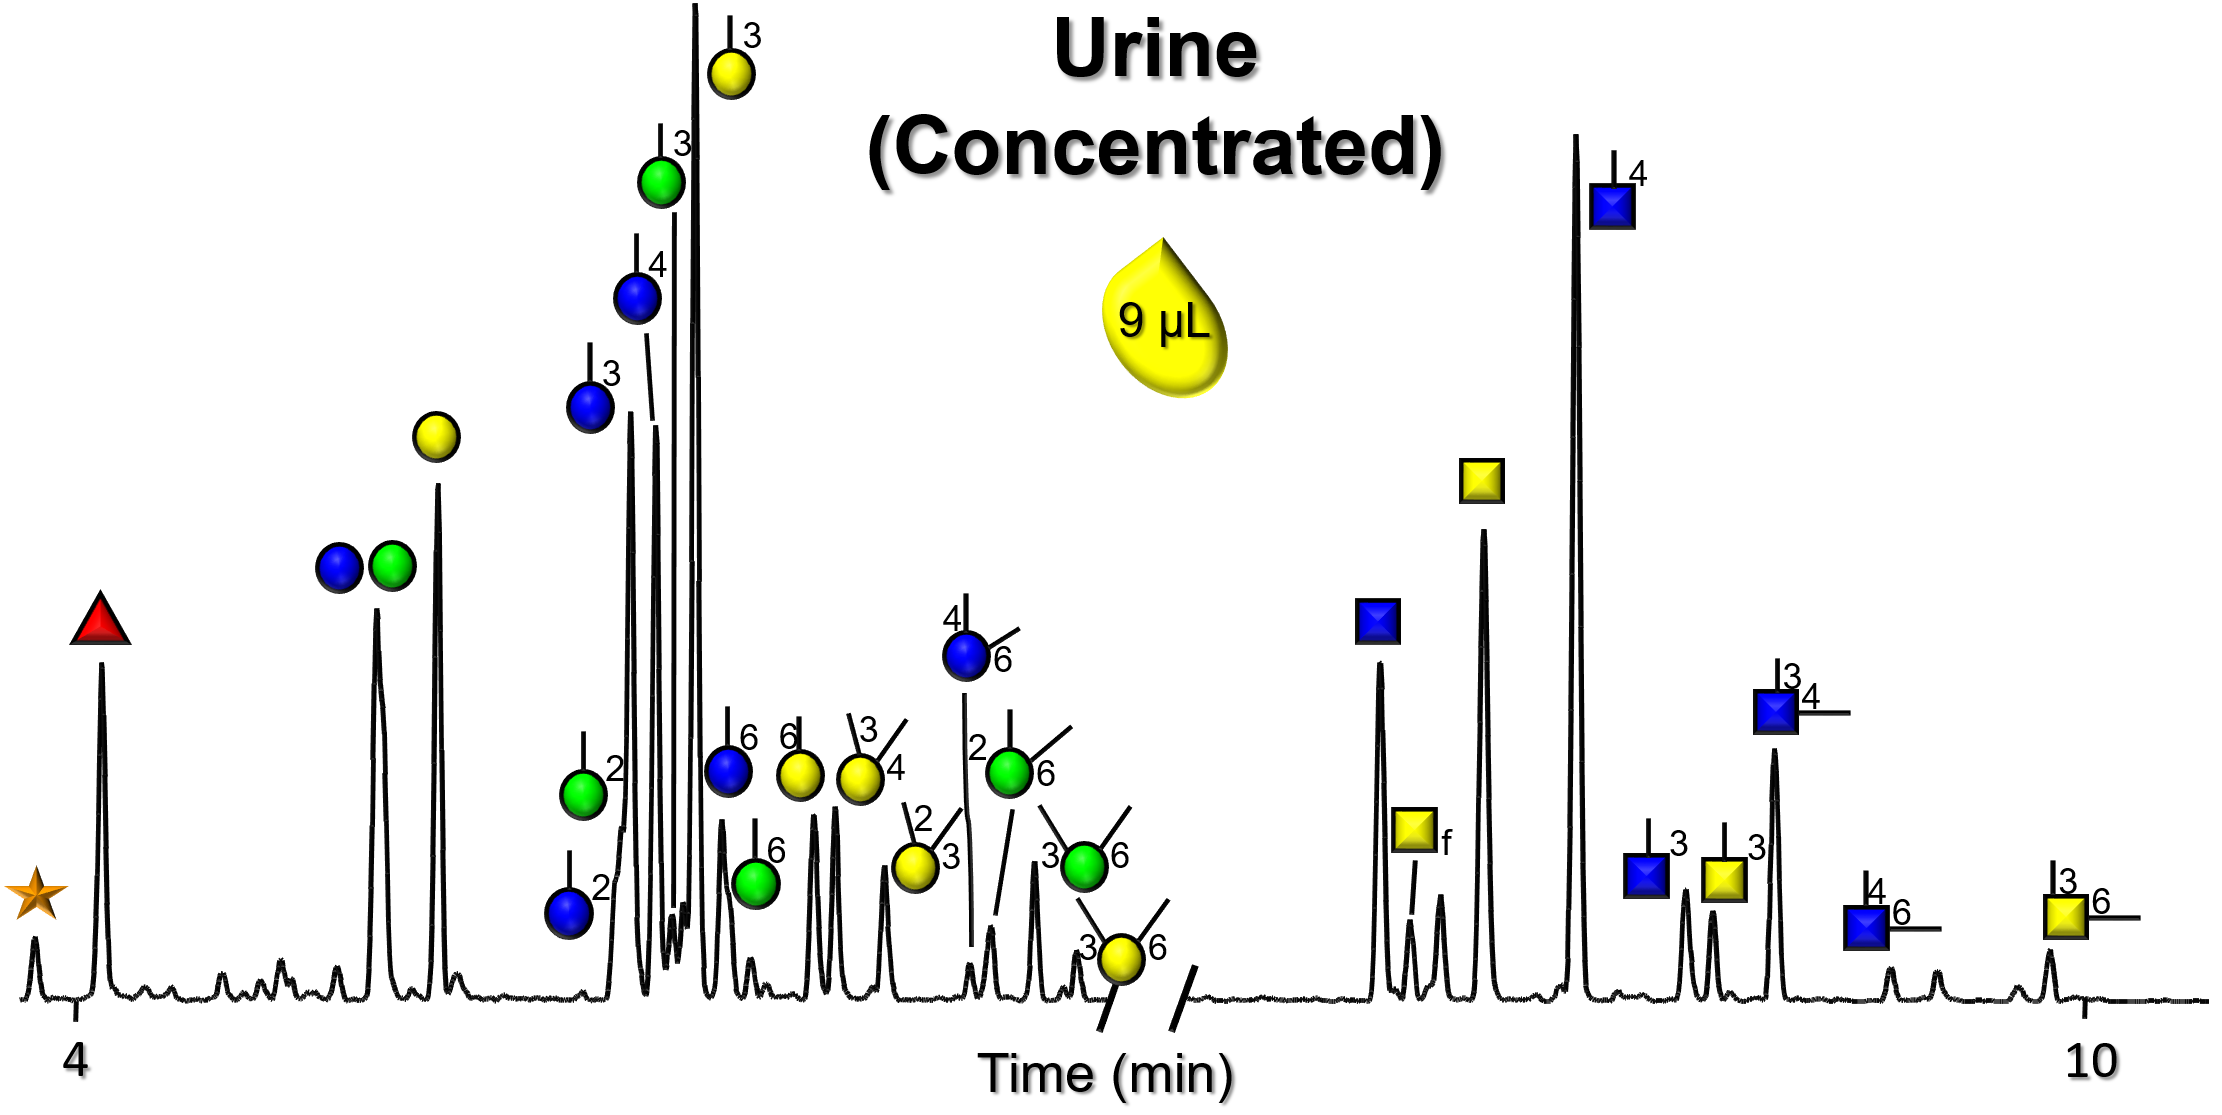
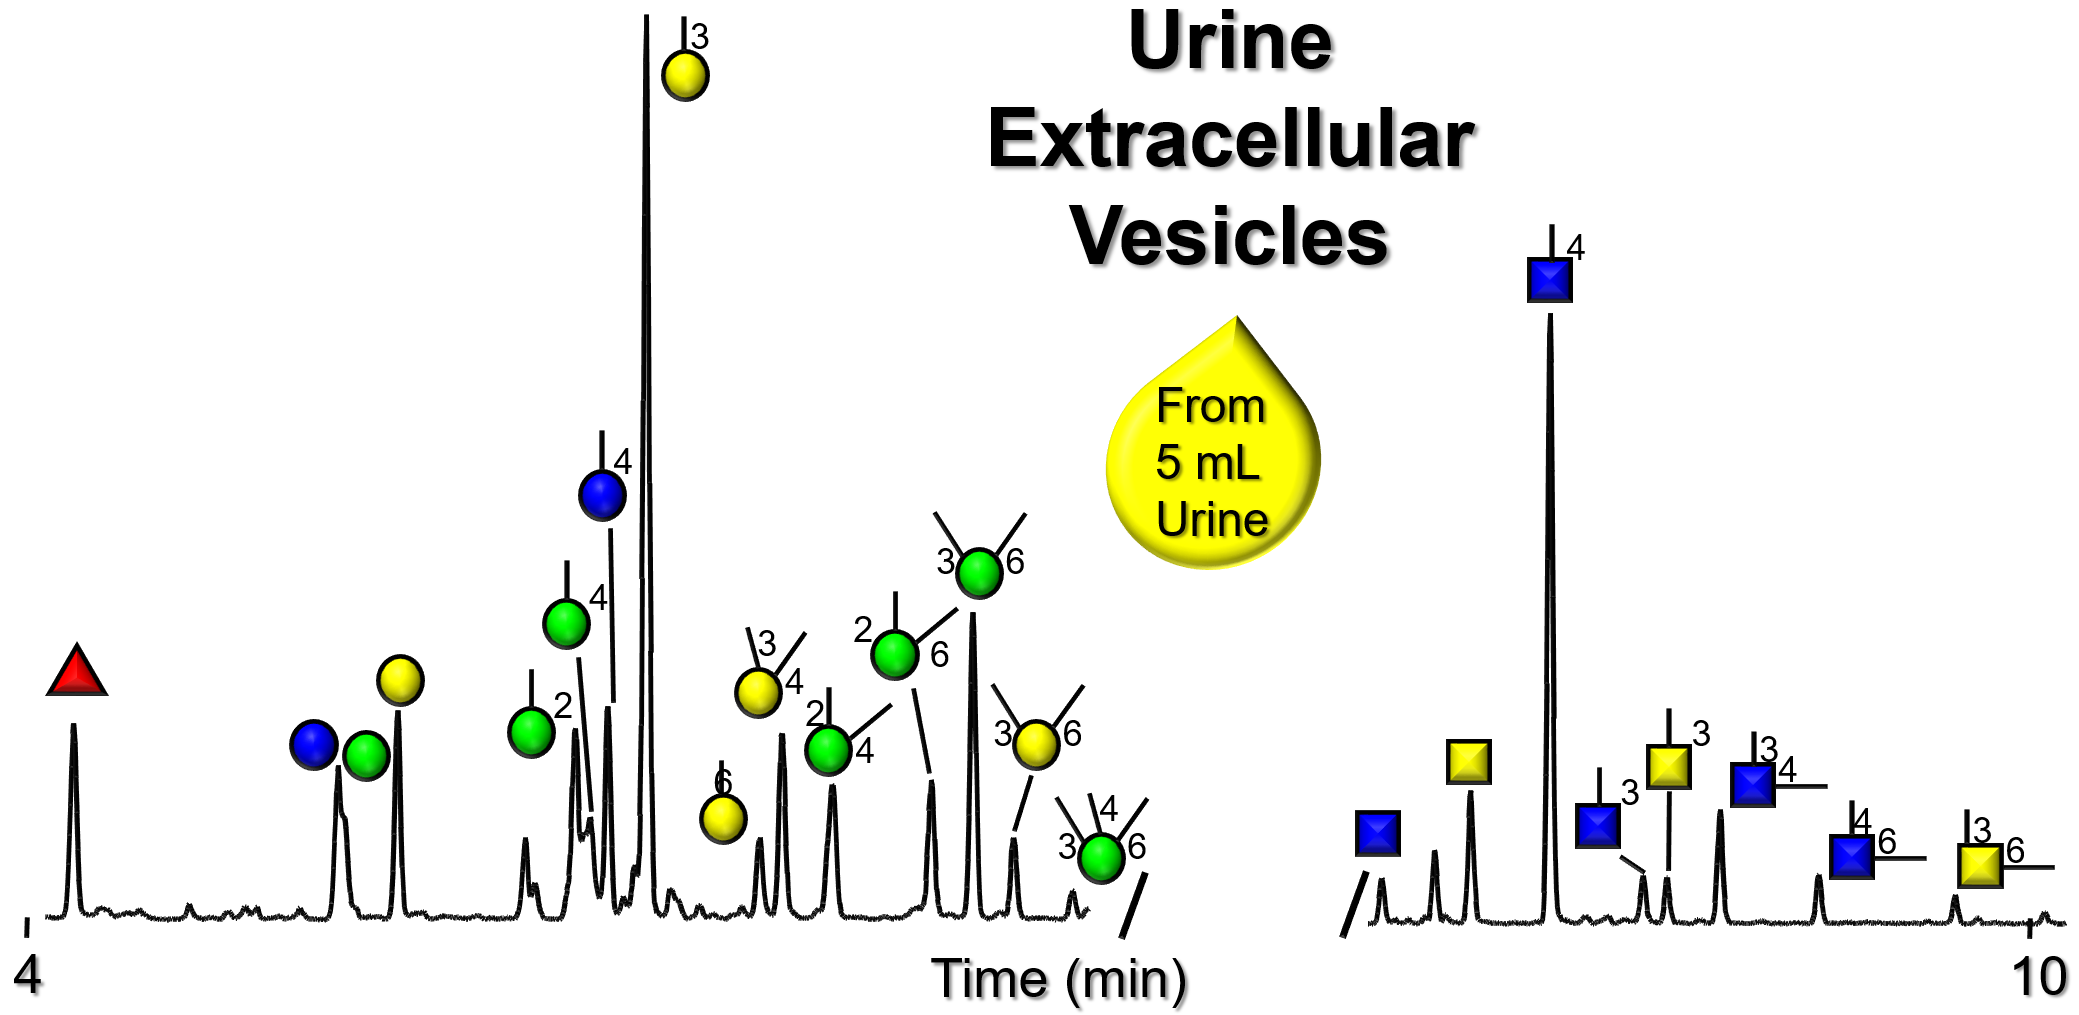
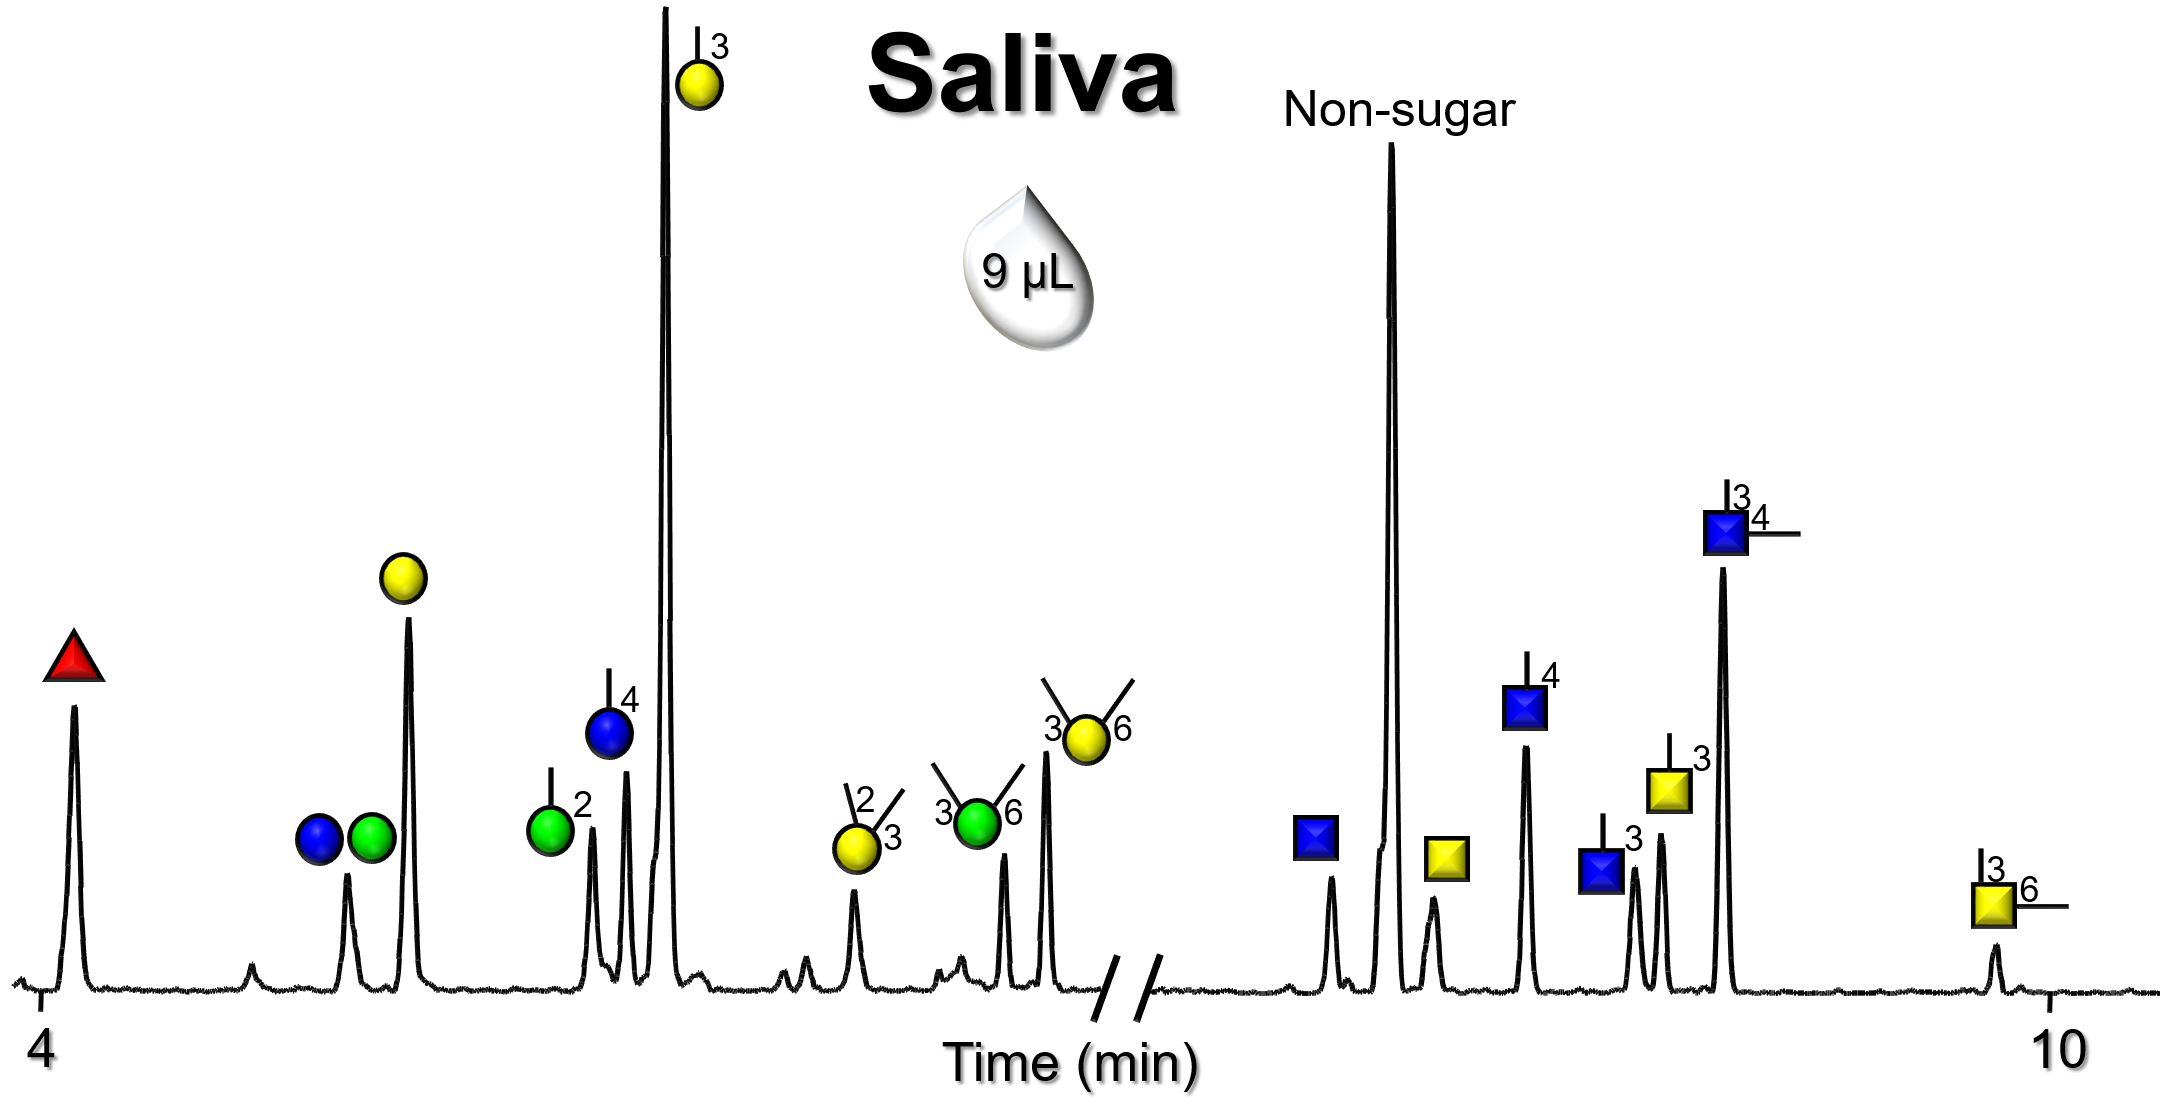
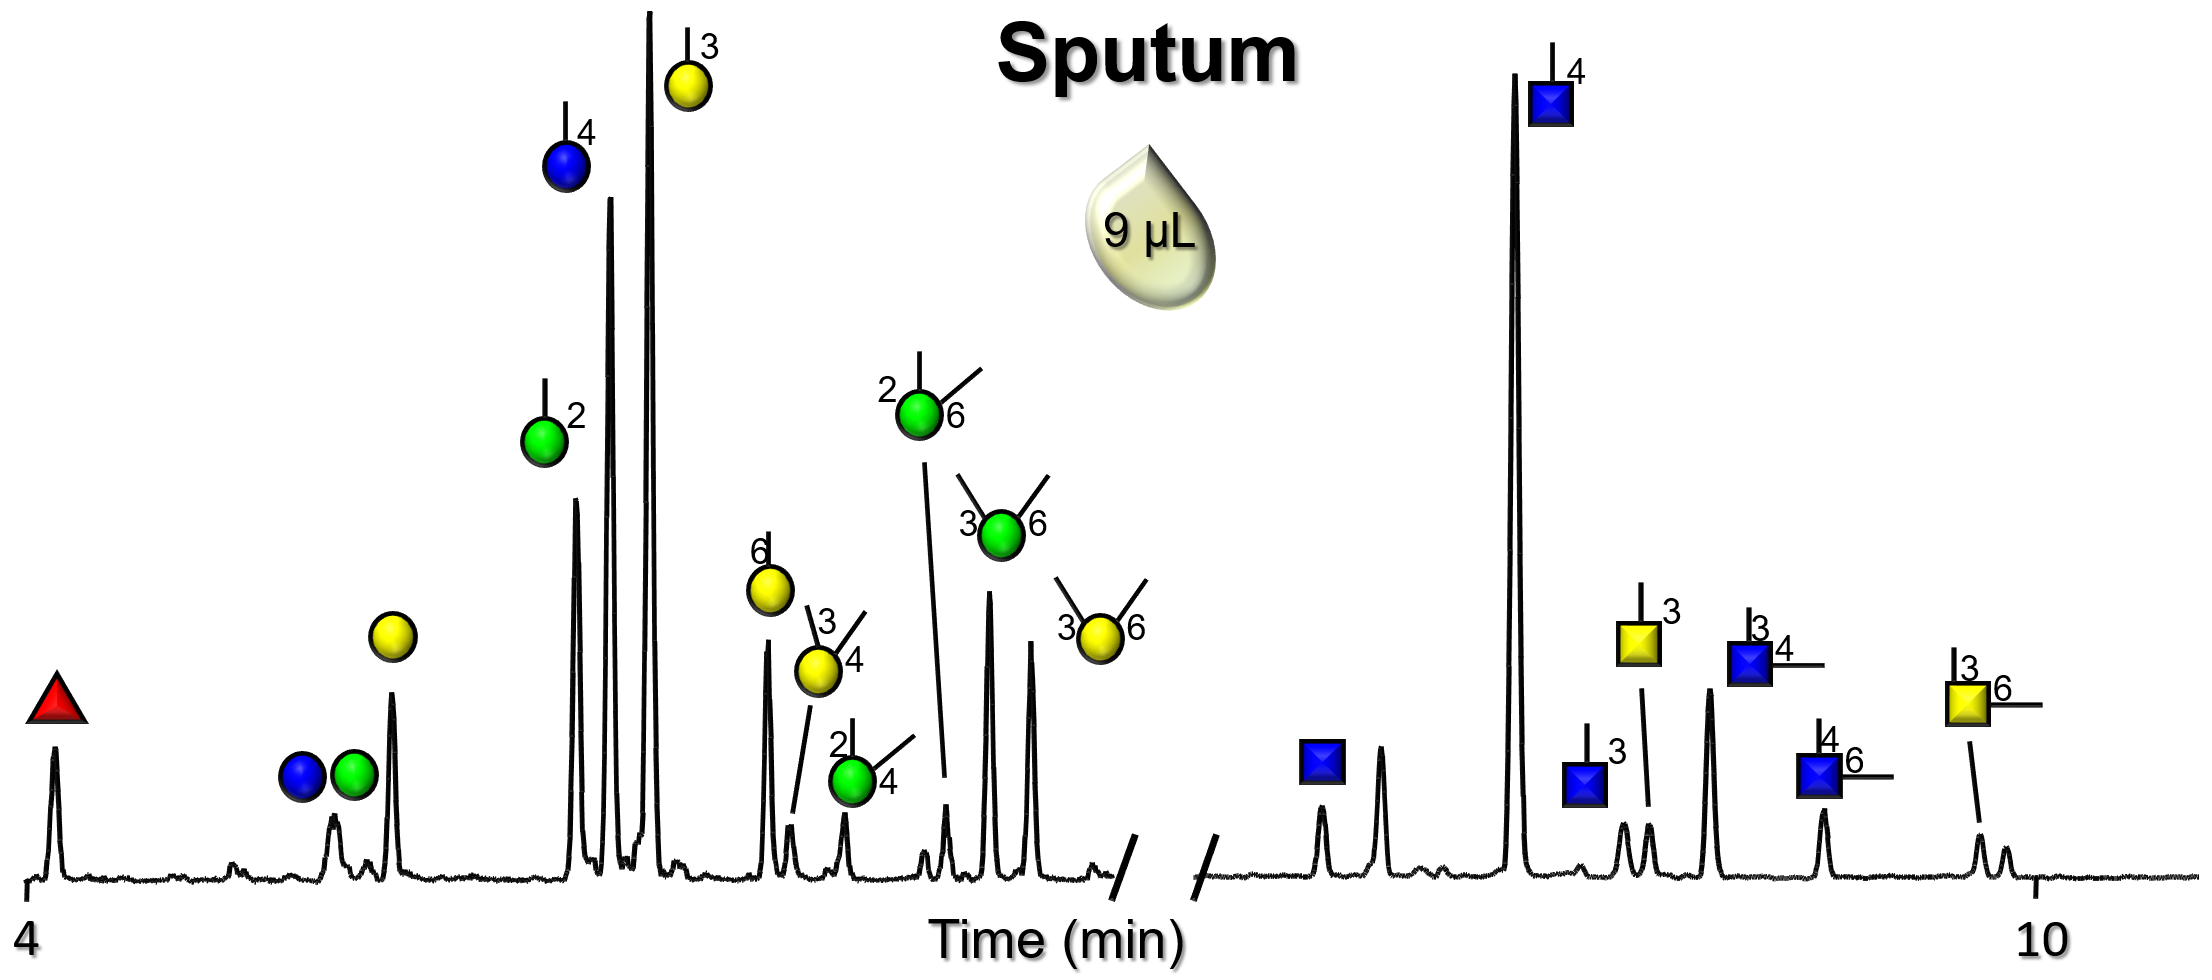
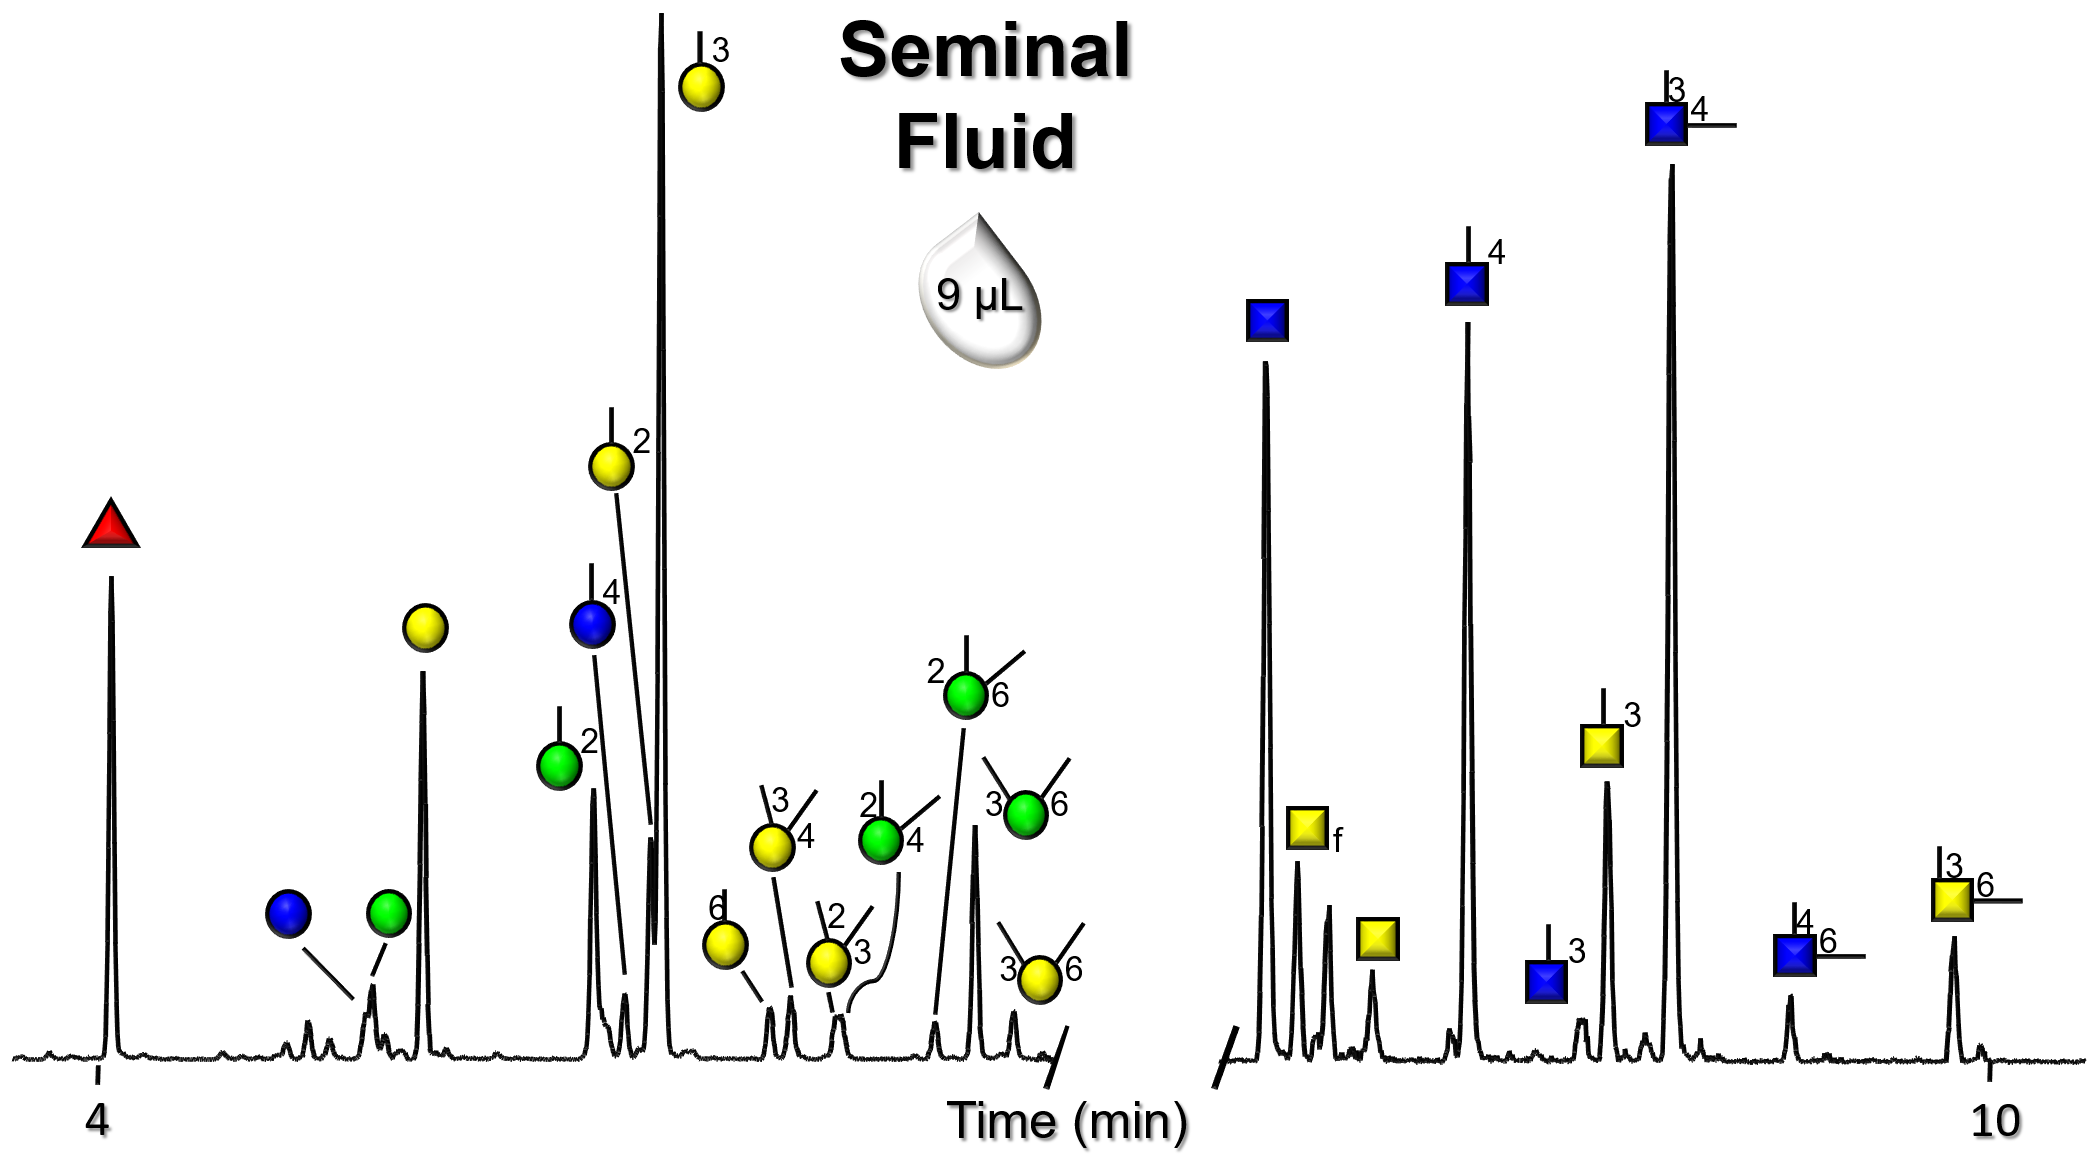
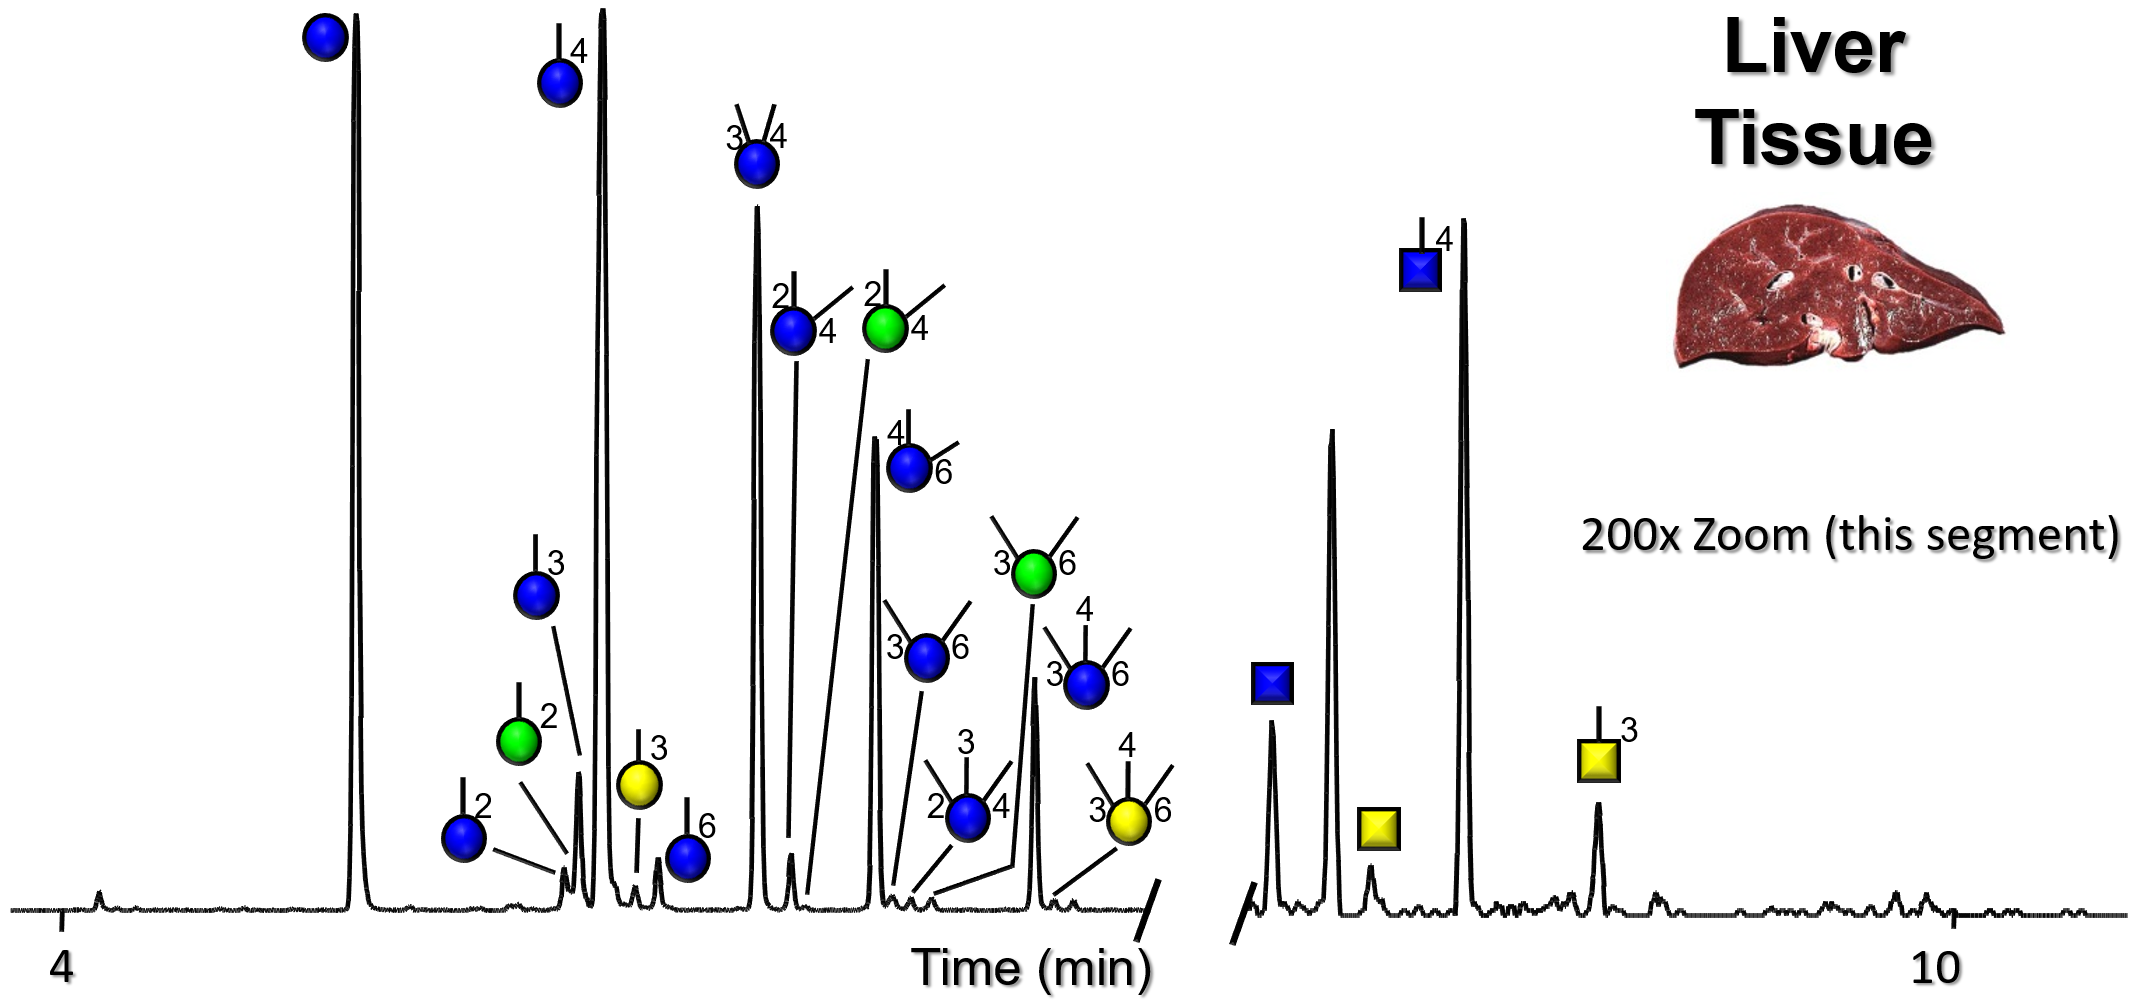
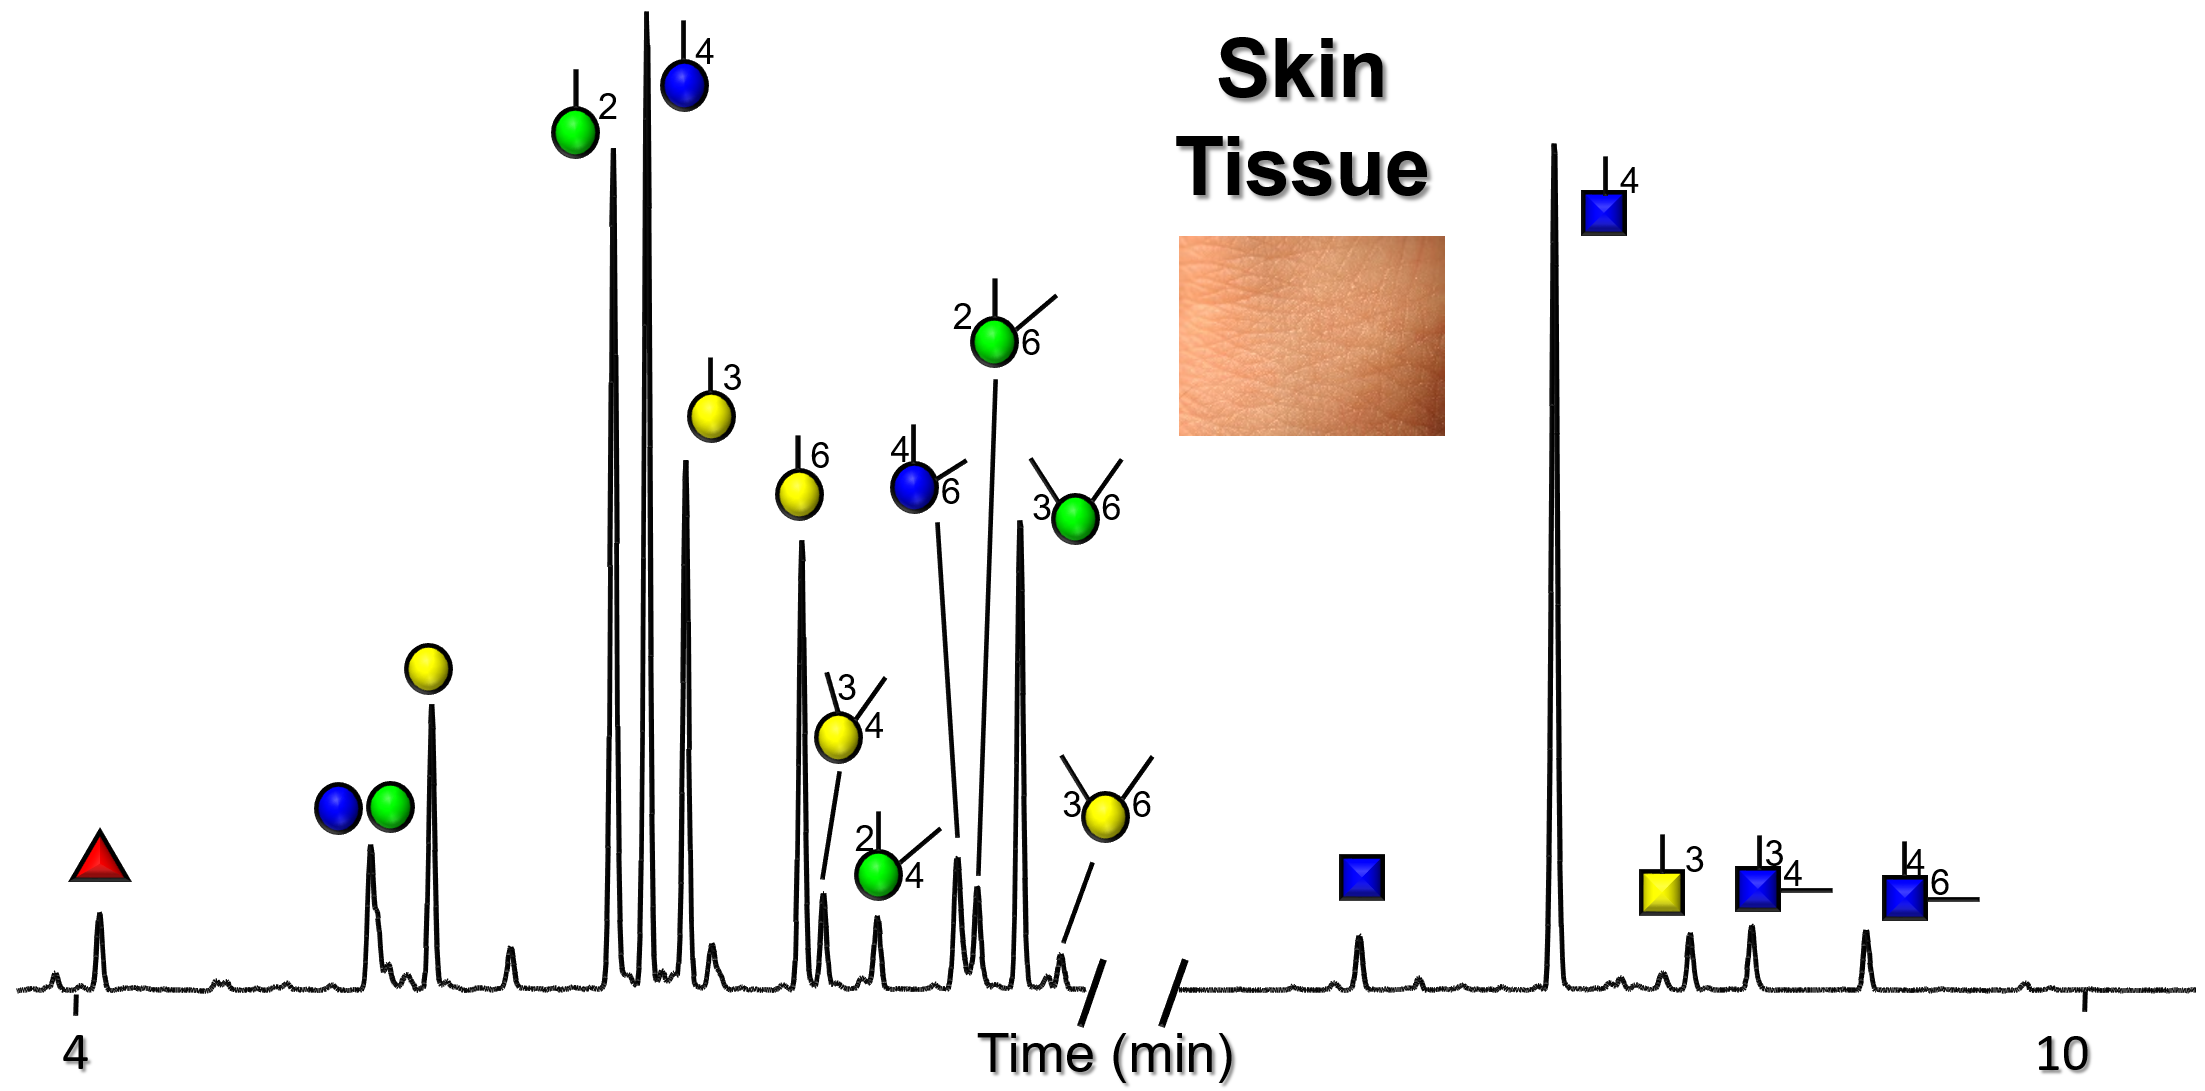
Gallery of Biomatrices
Glycan Node Profiles of Biomatrices Analyzed to Date Presented in the Form of Extracted GC/MS Ion Chromatograms